
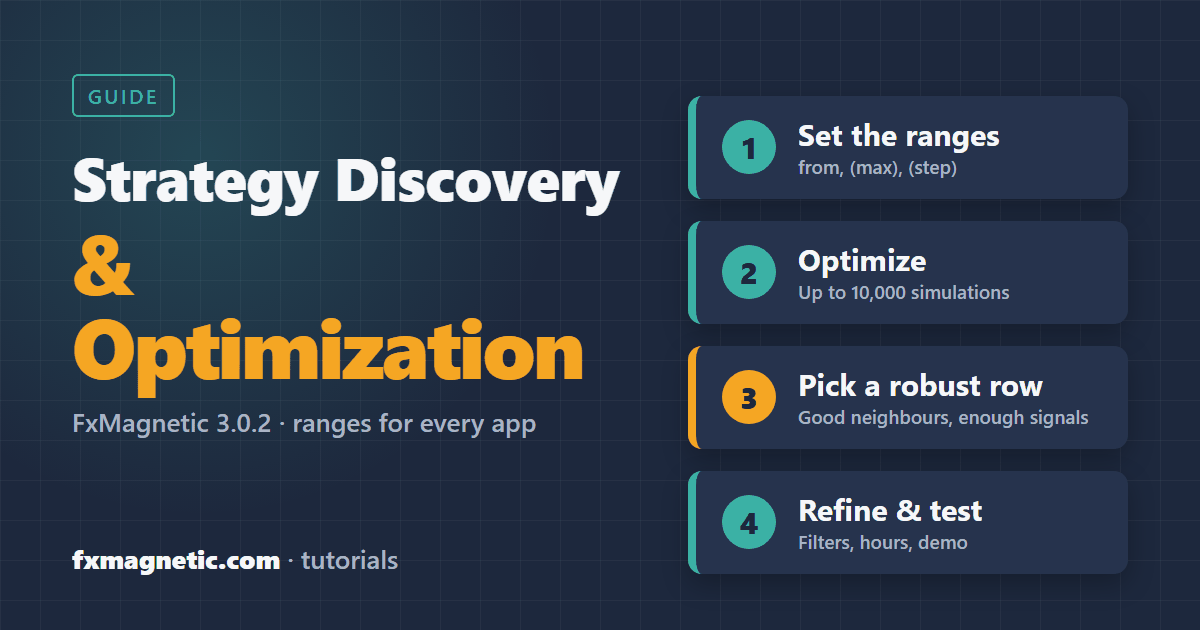
To discover a strategy with FxMagnetic, choose a symbol, timeframe and strategy, set a start value, a (max) and a (step) for the stop loss, take profit and the two strategy parameters in the Scanner panel, and press Optimize. The Scanner backtests every combination (up to 10,000 per run), switches the panel to the best one and saves all results to a CSV file. Then you pick a robust row, refine it with trade filters and trading hours, and test it on a demo account before you trade it.
This guide is for FxMagnetic 3.0.2 on MT4 and MT5 and works in every app. It includes the recommended optimization ranges for each strategy family, the same ranges as the earlier “Strategy Discovery & Optimization Cheat Sheet”, checked and updated for 3.0.2.
The workflow in 8 steps
- Choose the market: symbol and timeframe, on a chart with enough price history.
- Choose the strategy in (P2) Trading Strategy and Strict or Flexible in (P3).
- Choose the stop-loss type in (P4a) SL/TP Type. ATR works on every symbol and timeframe.
- Set the ranges in the panel: start value, (max) and (step) for SL, TP and the two parameters. Use the tables below.
- Set the acceptance rules in the Optimization Settings inputs (minimum signals, drawdown, losses in a row).
- Press Optimize and let it run.
- Pick a robust row in the CSV, not just the top one.
- Refine and test: trade filters, trading hours, then a demo account.
How Optimize works
The panel has four value fields at the top and their Optimization Settings below. The value fields are the start values; (max) is the last value tested and (step) the distance between values. The Scanner multiplies the number of values of each field and shows the result as Simulations.
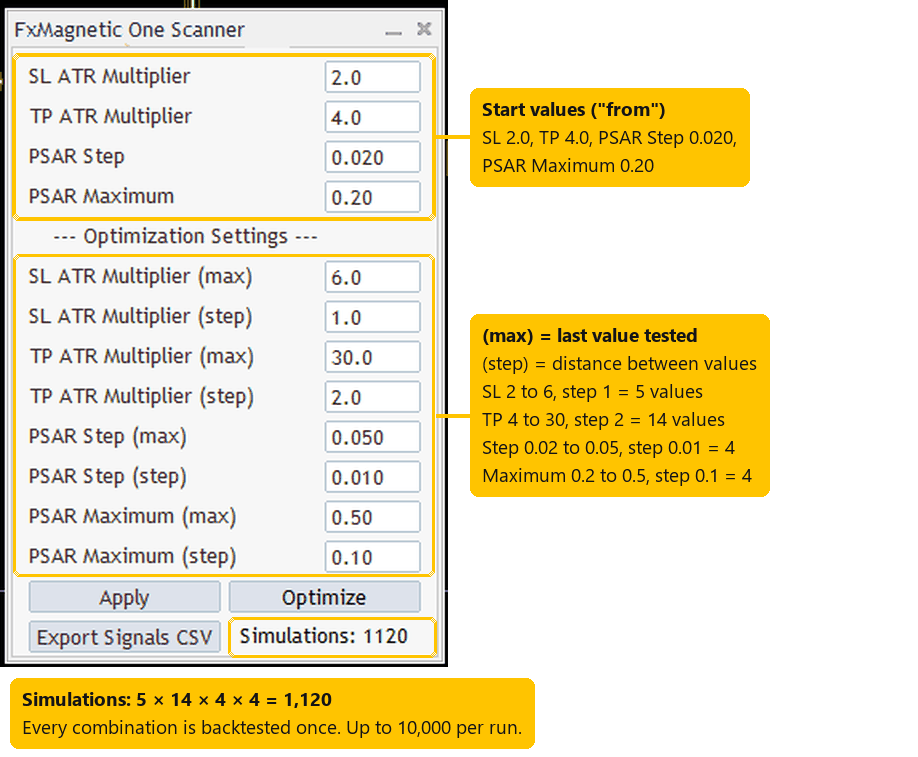
A real FxMagnetic One 3.0.2 panel (Parabolic strategy, MT5). 5 × 14 × 4 × 4 = 1,120 simulations.
- Optimize changes only these four values. The strategy, Strict/Flexible, stop-loss type, trade filters, trading hours and spread stay as you set them in the Inputs tab.
- Field names follow the strategy: “RSI Period / RSI Level” for RSI, “PSAR Step / PSAR Maximum” for Parabolic, and so on.
- With an ATR stop-loss type, SL and TP are multipliers of ATR(14); with Fixed (Points), they are points.
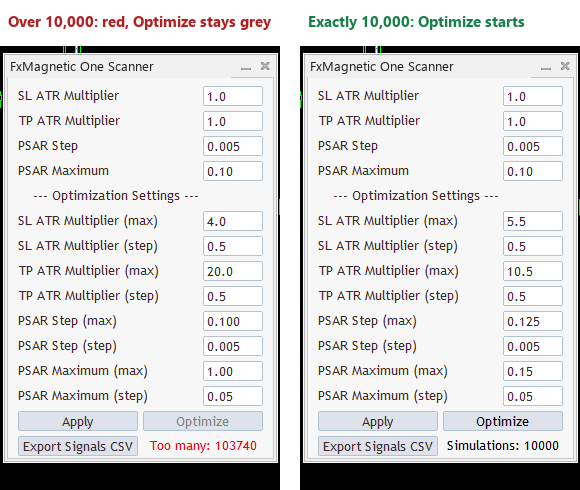
- A run takes up to 10,000 simulations. If your ranges ask for more, the panel shows “Too many: N” in red and Optimize stays grey; use bigger steps or narrower ranges. Once Optimize is running, the panel shows the time left.
Before you optimize
- History: open the chart and wait until the statistics appear; 3.0.2 downloads missing history by itself. More history gives more signals per simulation.
- (P1) How many signals to display: this is also how many signals each simulation is judged on. 50 is a quick look; 100 or 200 is a much more reliable test.
- Strict or Flexible (P3): Strict gives fewer, cleaner signals; Flexible gives more. Run both and compare.
- Stop-loss type (P4a): ATR adapts to every symbol and timeframe, so the same ranges work everywhere. Fixed points need different ranges per symbol (tables below).
- (P9) Artificial Spread: adding a realistic spread (in points) makes the backtest closer to live trading, especially on lower timeframes.
- Trade filters and trading hours: you can set them before Optimize, or optimize first and add them afterwards to compare.
Optimization Settings (Inputs tab)
These inputs decide which simulations count as acceptable and which one the Scanner picks as “best”. 0 means “not used”.
| Setting | What it does | Suggestion |
|---|---|---|
| Pick Best Optimization Params Based On X | Which result the panel switches to after Optimize: Highest Profit in Points, Highest Win Ratio, Highest Return-to-Drawdown Ratio, Highest Profit in R-Multiples or Highest Expectancy in R-Multiples. | Return-to-Drawdown or Profit in R-Multiples. |
| Minimum Signals To Accept Settings | Simulations with fewer signals are ignored. | 25 or more; the same as (P1) for a strict test. |
| Minimum / Maximum Risk:Reward Ratio | Accept only TP:SL ratios in this range. Skip Simulations Outside RR Limits = true doesn’t even run them, which saves time. | For example 1 to 10. |
| Minimum Return:Drawdown Ratio | Ignore results whose profit is too small for their drawdown. | 2 or 3. |
| Max Consecutive Losses | Ignore results with longer losing streaks. | 6–8, or what your account or prop-firm rules can take. |
| Minimum / Maximum Signals Per Week | Keep only strategies that trade about as often as you want. | For example at least 1 per week. |
| Maximum Weeks To Accept Settings | The signals must fit in this many weeks (rejects strategies whose last N signals go back too far). | 0, or a limit such as 52. |
| Save Optimization Results To File | Save All Variations, Save Only Matching Strategies, or Don’t Save Results. | Save All Variations. |
| CSV Delimiter | Column separator in the CSV file. | “,” or “;” for European Excel. |
Recommended ranges with an ATR stop loss (all symbols and timeframes)
Type the “from” value into the panel field, then the (max) and (step). The last column is the number of simulations for that row; with the 10,000 limit you can also use finer steps.
| Strategy family (app) | SL (ATR) | TP (ATR) | Param1 | Param2 | Simulations |
|---|---|---|---|---|---|
| RSI Break-in / Break-out (RSI Trader) | 1–5, step 1 | 2–20, step 1 | RSI Period 7–42, step 7 | RSI Level 10–40, step 10 (10 = 10/90) | 2,280 |
| Bollinger Bands (BB Trader) | 1–10, step 1 | 2–20, step 1 | BB Period 10–40, step 10 | Deviation 1.0–3.0, step 0.5 | 3,800 |
| MACD (MACD Trader) | 1–5, step 1 | 2–15, step 1 | Fast EMA 12–96, step 12 | Slow EMA 26–208, step 26 | 4,480 |
| Parabolic SAR (Parabolic Trader) | 2–6, step 1 | 4–40, step 2 | PSAR Step 0.005–0.05, step 0.005 | PSAR Maximum 0.1–0.5, step 0.1 | 4,750 |
| Stochastic (Stochastic Trader) | 2–6, step 1 | 4–18, step 2 | Stochastic Code 50303–451333, step 10* | Stochastic Level 20–40, step 10 | 4,800 |
| Moving averages (Flow Trader) | 2–6, step 1 | 4–30, step 2 | MA Period 10–90, step 10 | Slow MA 20–100, step 10; or No Touch Bars / Lookback Bars 5–30, step 5 | 5,670 / 3,780 |
| Fair Value Gap (FVG Trader) | 2–6, step 1 | 4–30, step 2 | Max Bars Since FVG 5–30, step 5 | Gap Penetration % 10–90, step 10 | 3,780 |
| Breakouts (Breakout Trader) | 2–4, step 1 | 2–20, step 2 | Range / Pre-Range Minutes 5–120, step 5 | Max Range Height (ATR) 0–10, step 2 (0 = off) | 4,320 |
| RSI Divergence (Divergence Trader) | 2–6, step 1 | 2–30, step 1 | RSI Period 7–21, step 7 | Divergence Strength 1–19, step 2 (maximum is 20) | 4,350 |
| Candlesticks: Inverted Hammer & Shooting Star, Hammer/Hanging Man, Pinbar, Spinning Top | 2–6, step 1 | 2–15, step 1 | Candle Body Size 20–60, step 20 | Lookback Bars 2–20, step 1 | 3,990 |
| Candlesticks: Doji | 2–6, step 1 | 2–15, step 1 | Candle Body Size 5–10, step 1 (Doji has its own scale in 3.0.2) | Lookback Bars 2–20, step 1 | 7,980 |
| Candlesticks: Engulfing, Three Soldiers/Crows, Morning & Evening Star | 2–10, step 1 | 2–20, step 1 | Candle Body Size 50–80, step 10 | Lookback Bars 1–21, step 5 | 3,420 |
* The Stochastic Code combines %K, %D and Slowing, two digits each (50303 = %K 5, %D 3, Slowing 3). A step of 10 moves each part by 10: %K 5, 15 … 45, %D 3 and 13, Slowing 3, 13, 23 and 33.
Recommended ranges with a fixed stop loss (points)
With Fixed (Points), the SL and TP ranges depend on the symbol and timeframe. Keep Param1 and Param2 as in the ATR table. Typical ranges:
| Symbol and timeframe | SL (points) | TP (points) |
|---|---|---|
| XAUUSD (gold), M15 | 500–4000, step 500 | 1500–9000, step 1500 |
| XAUUSD (gold), H1 | 2000–8000, step 1000 | 4000–16000, step 2000 |
| EURUSD and other majors (GBPUSD, USDCAD …), M15 | 100–600, step 100 | 200–1600, step 200 |
| EURUSD and other majors, H1 | 200–1000, step 200 | 400–4000, step 400 |
| GBPJPY and other JPY pairs, M15 | 400–1600, step 200 | 800–3200, step 400 |
| GBPJPY and other JPY pairs, H1 | 1000–5000, step 1000 | 2000–10000, step 1000 |
For other timeframes, scale the ranges: lower timeframes need smaller stops, higher timeframes larger ones. Indices, gold and crypto on D1/W1 can use fixed stops up to 10,000,000 points.
Run Optimize and read the results
- Press Optimize. The panel shows the progress and the time left; leave MetaTrader alone while it runs.
- When it finishes, the panel switches to the best result by your Pick Best … choice, and an Open CSV button appears.
- Click Open CSV. Every simulation is a row, with its settings and results (signals, win rate, profit in R, maximum drawdown, Return/Drawdown, losses in a row).
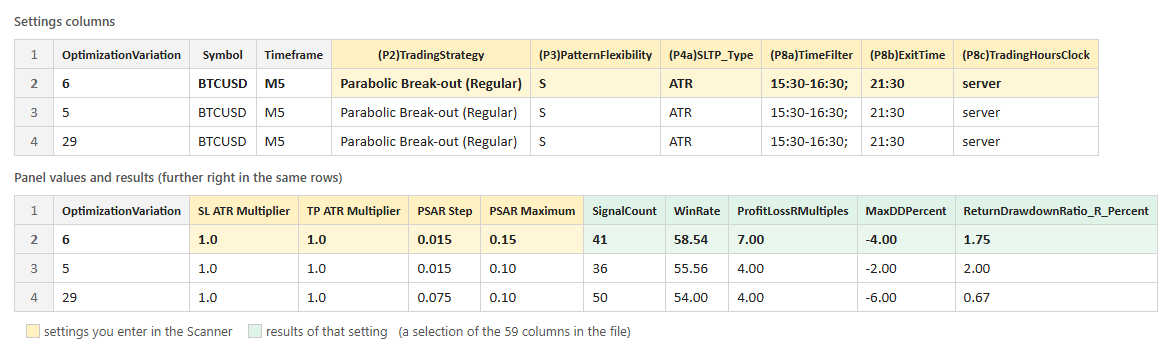
How to put a row’s settings back on the chart: How to Set Up a Strategy From a CSV File.
Pick a robust row, not just the top one
The single best row of thousands is often partly luck. A strategy is more likely to hold up when:
- It has enough signals: at least 50, better 100 or more.
- Its neighbours are good too: the rows with slightly different values (one step up or down) are also profitable. A lonely peak among losing neighbours is a warning sign.
- Drawdown and losing streaks fit your account: check Max Drawdown (in R, the same as % at 1% risk) and Max consecutive losses against your daily and total loss limits.
- It trades often enough for your plans (Signals per week).
- The risk:reward makes sense: very large TP:SL ratios with a low win rate can have long losing runs.
Refine
- Zoom in: run a second Optimize with narrower ranges and smaller steps around the row you like.
- Compare Strict and Flexible with the same ranges.
- Add a trade filter (Trade Filter #1 and #2) and compare the statistics. Examples that have worked well:
- London Breakout (Reverse), EURUSD M5: ADX (same timeframe, Param1 14, Param2 30); ATR is Rising (14); BBands Buy/Sell when outside (same timeframe or H4, Param1 60 or 120, Param2 1); EMA Above=Sell/Below=Buy (100 or 250).
- NY Opening Range Breakout (Regular), EURUSD M5: EMA Above=Buy/Below=Sell (same timeframe or H4, 25).
- RSI Hidden Divergence (Regular), GBPUSD and XAUUSD M5: ADX (14, 20); EMA Above=Sell/Below=Buy (250); BBands Buy/Sell when inside (H4, 120, 1.0); PSAR Above=Sell/Below=Buy (H4, 0.02, 0.2).
Details: How to Use Trade Filters and Trade Filter parameters.
- Limit the trading hours to the session where the strategy works best: Trade only in New York or London hours.
Test before you trade
- Run the strategy with the Autotrader on a demo account first, for a few weeks.
- Check it on your live broker’s data too: prices and history differ between brokers (Broker Data Paradox).
- Use a small risk per trade (for example 0.5–1%) and Close & Pause rules for losing streaks and equity: Autotrader settings.
- Backtests describe the past. Past results do not guarantee future results, and every strategy has losing periods.
Quick reference
- Up to 10,000 simulations per run; use (step) to control the count.
- Judge on 100+ signals; accept at least 25.
- Prefer ATR stops for one range that fits every symbol.
- Choose a robust row (good neighbours), not just the top row.
- Zoom in, compare Strict/Flexible, add a filter, set hours, then demo.
FAQ
How many simulations should I run?
A broad first run of 3,000–6,000 is a good start (the tables above), then a narrower second run. 3.0.2 runs up to 10,000 at a time.
Does Optimize also test trade filters or trading hours?
No. Optimize varies the stop loss, take profit and the two strategy parameters. Filters, hours, Strict/Flexible and the stop-loss type stay as set; change them by hand and compare.
Should I use ATR or fixed stops?
ATR adapts to volatility and works with the same ranges on every symbol and timeframe, so it’s the easiest start. Fixed points can suit a single symbol you know well.
The best result from last month doesn’t look as good now.
Normal: the statistics always use the latest signals, and markets change. Re-check your strategies regularly and keep the ones whose results stay stable.
Where are the CSV files?
File > Open Data Folder, then MQL4 > Files (MT4) or MQL5 > Files (MT5), in a folder named after your app ending in “Optimization Results”. The Open CSV button opens the latest one.
