In this tutorial, you will learn how to use trade filters with FxMagnetic. These Trade filters help filter out bad trades and pick the trade direction more accurately. By the end of this tutorial, you’ll be able to apply different trade filters and interpret the results accordingly.
About Trade Filters
A trade filter that helps traders narrow down and focus on specific trades based on certain criteria. By nature, filtering something out will filter the bad things and some of the good stuff. It means, for example, sometimes the Trend Filter can filter out good trades as well. However, we have seen that in many cases, the Trend Filter allows the FxMagnetic pattern scanner to pick better trades.
How to Apply the Trade Filters
The trade filters feature has been introduced in FxMagnetic version 1.2.3, it is not available in older versions of FxMagnetic. In this tutorial, we are using FxMagnetic Onyx to demonstrate, but the same Trade Filters can be applied with other FxMagnetic candlestick scanners like the HHM, STAR, or Engulfing (You must use FxMagnetic version 1.2.4). In your MetaTrader account, follow these steps to attach the FxMagnetic Onyx indicator to your chart:
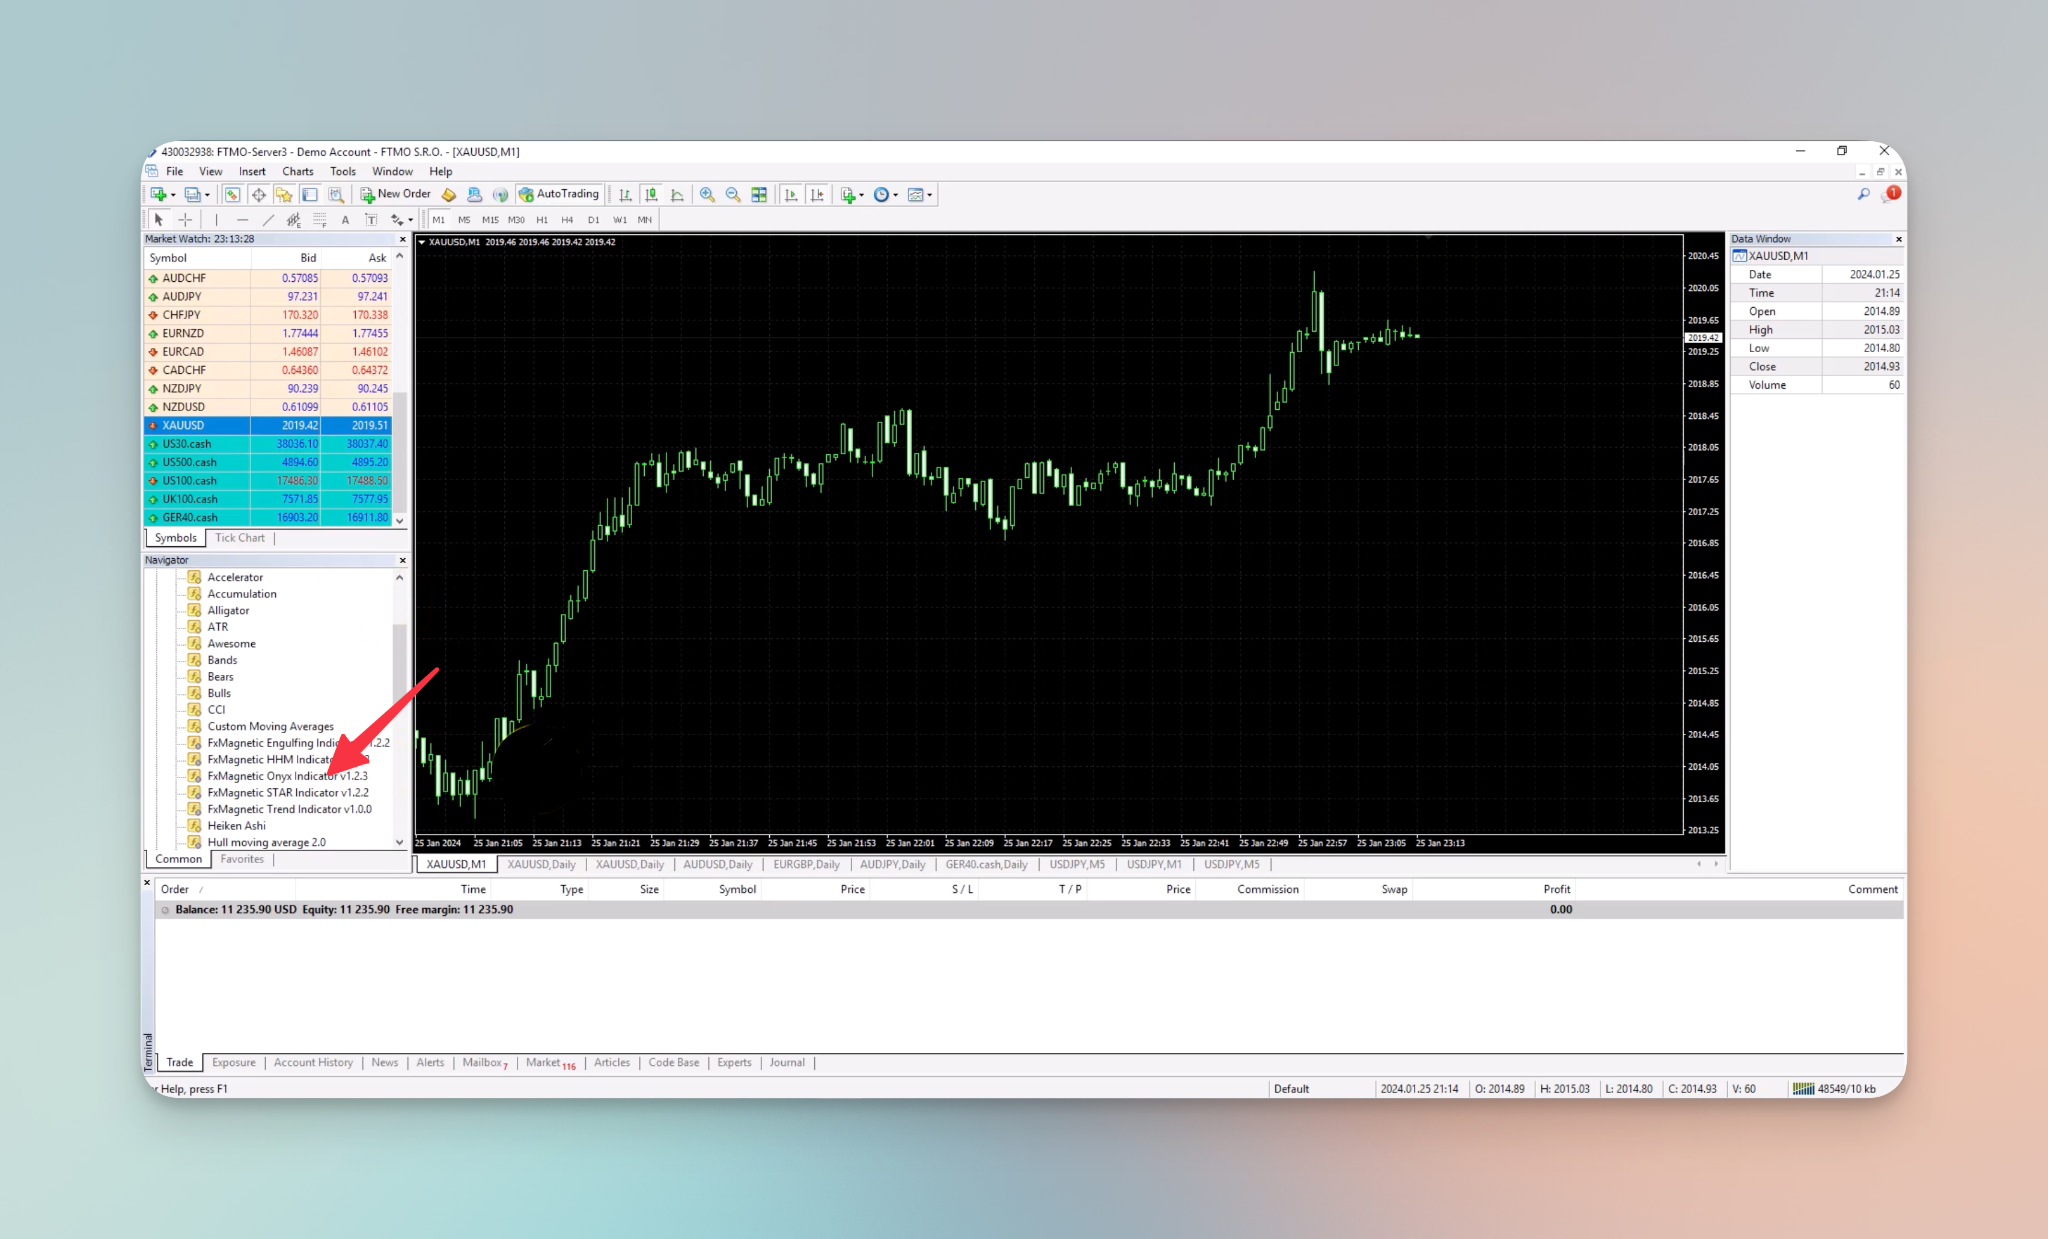
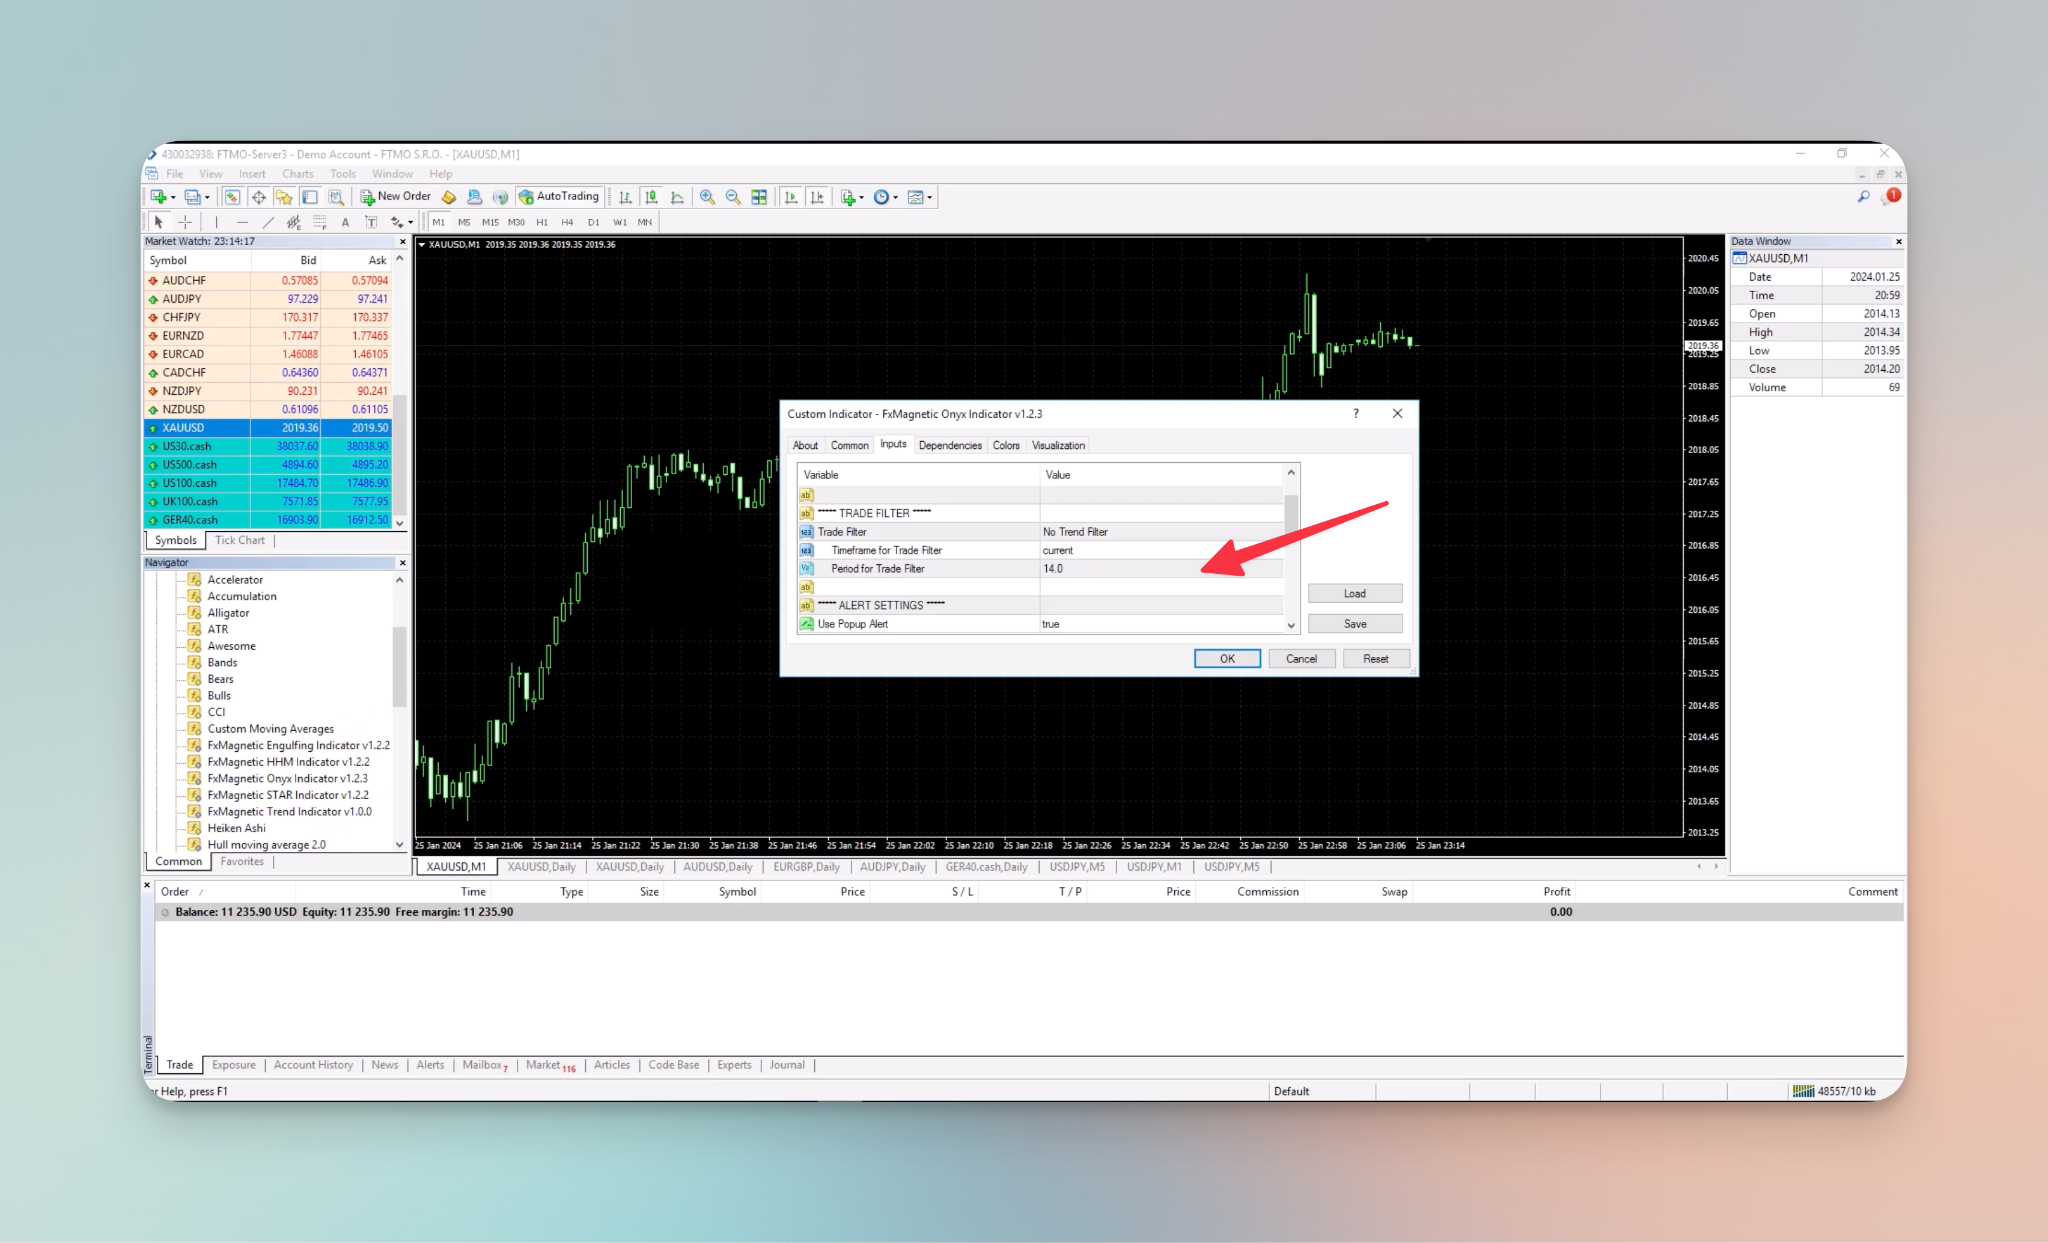
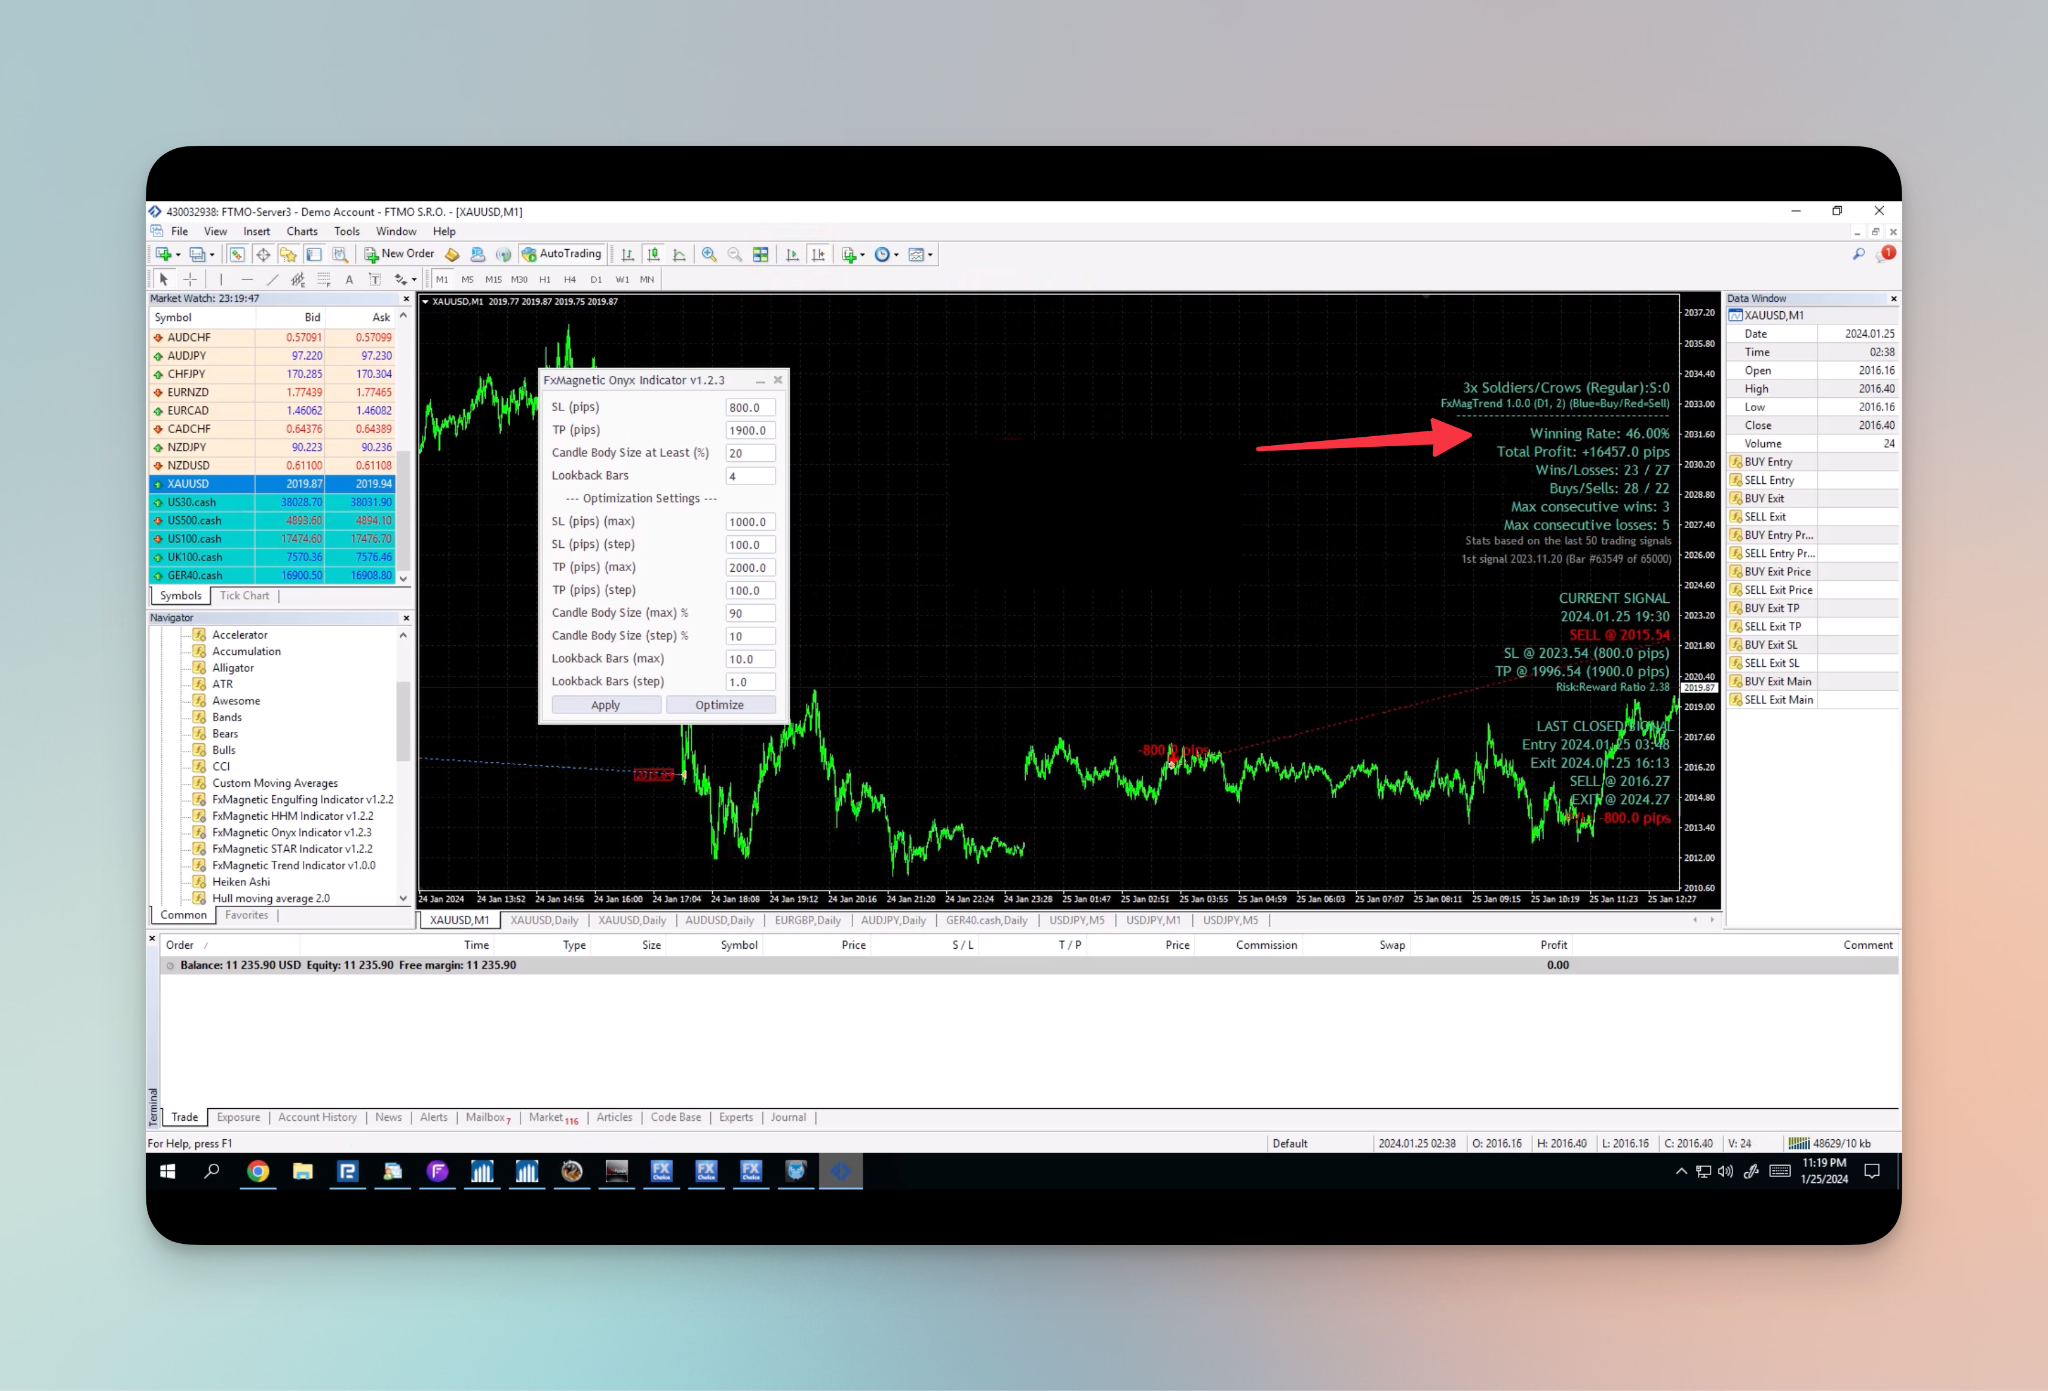
- Drag and drop the FxMagnetic Onyx Indicator to your chart from the Navigator panel on the bottom left.
- To access the trade filter settings, go to the indicator settings and then inputs.
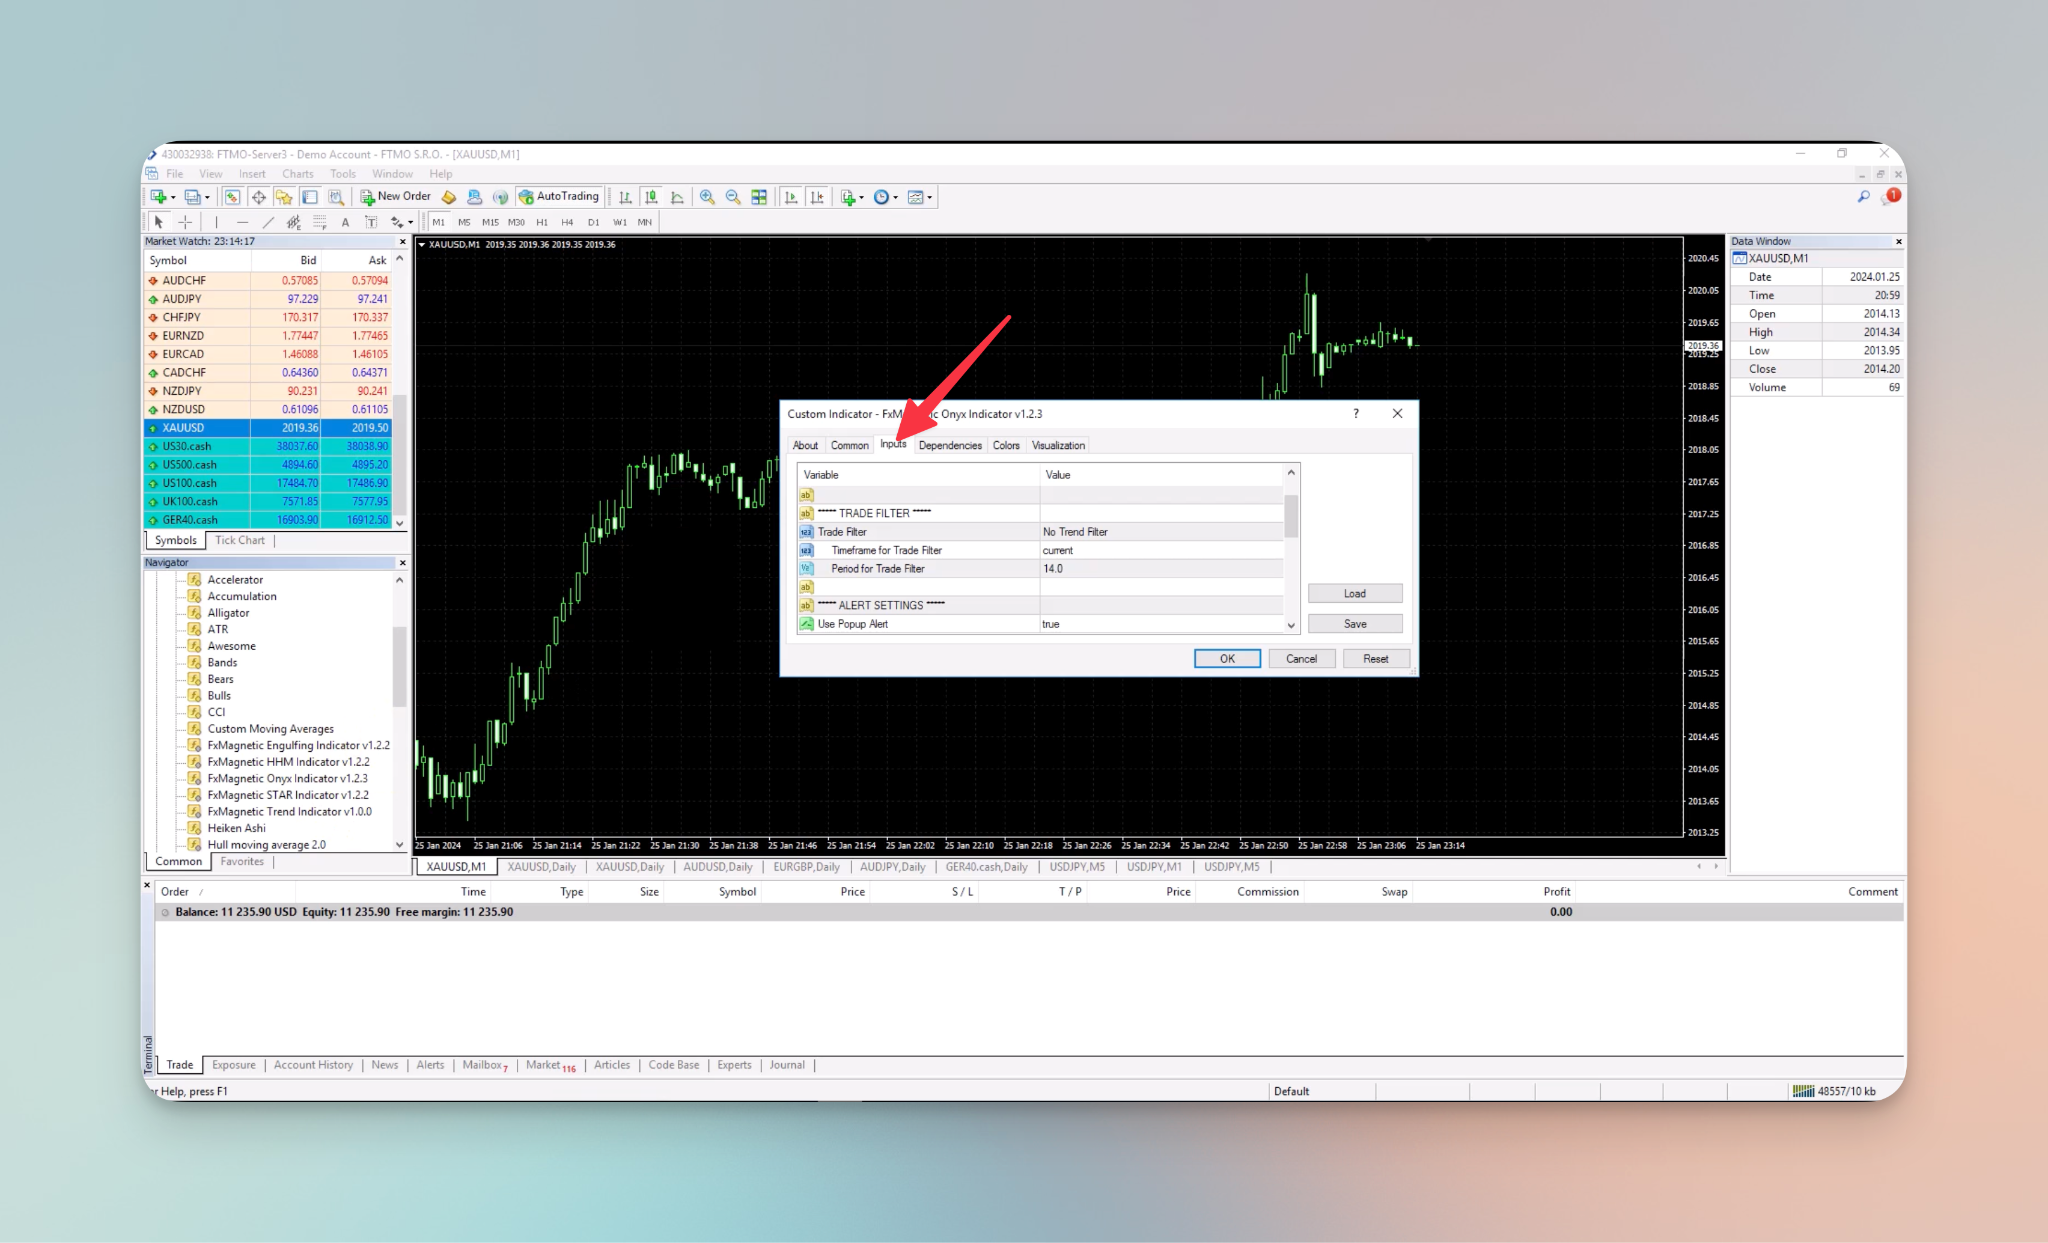
- Look for the Trade Filter option to apply the trade filters and access further adjustable settings.

Trade Filters
To apply a trade filter navigate to the “Trade Filters” option and select from the dropdown list.
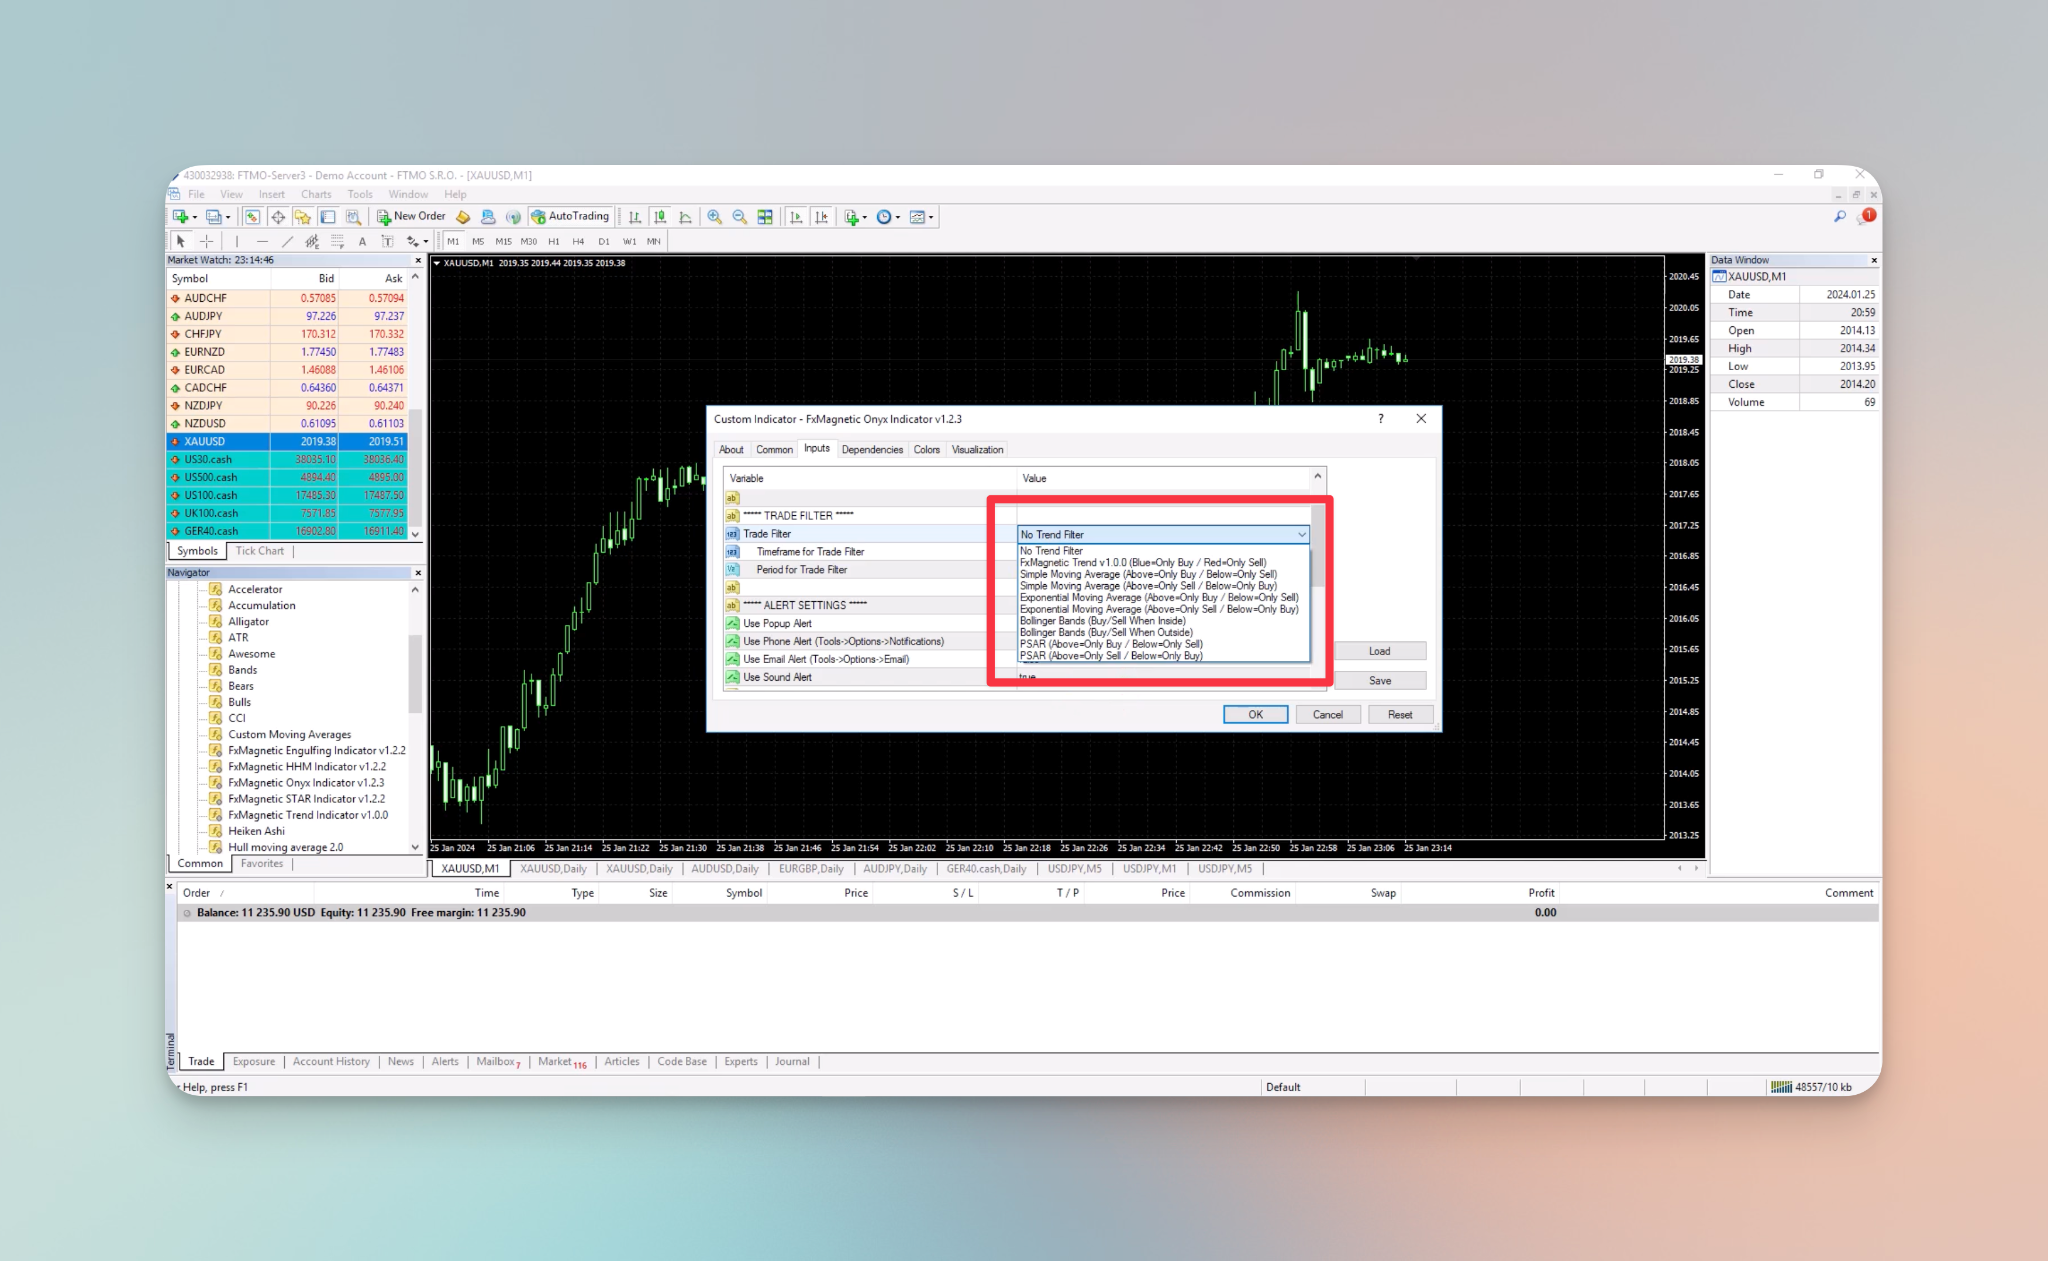
Select which trade filter you want according to your preference. The available options are:
- No Trade Filter: No specific filters are applied, allowing all trade signals to be considered without additional conditions.
- FxMagnetic Trend v1.0.0 (Blue=Only Buy/Red=Only Sell): Requires the separate installation of the FxMagnetic Trend indicator; it generates buy signals in blue and sell signals in red.
- Simple Moving Average (Above=Only Buy/Below=Only Sell): Simple Moving Average refers to a stock’s average closing price over a specified period. The reason the average is called “moving” is that the stock price constantly changes, so the moving average changes accordingly. This filter only accepts buy trades if the price is above the simple moving average and only accepts sell trades if the price is below the simple moving average.
- Simple Moving Average (Above=Only Sell/Below=Only Buy): This filter functions inversely to the previous setting, allowing only sell trades above the simple moving average and only buy trades below it.
- Exponential Moving Average (Above=Only Buy/Below=Only Sell): Exponential Moving Average is a weighted average that prioritizes prices offering a more responsive trend indication. This filter accepts buy trades when the price is above the exponential moving average and sell trades when the price is below it.
- Exponential Moving Average (Above=Only Sell/Below=Only Buy): This filter operates oppositely, allowing only sell trades above the exponential moving average and only buy trades below it.
- Bollinger Bands (Buy/Sell When Inside): Bollinger Bands are a technical analysis tool consisting of a middle band being a Simple Moving Average and two outer bands representing standard deviations from the SMA. They provide a visual representation of price volatility and potential trend reversal points. This filter allows buy and sell signals if the price is within the Bollinger Bands.
- Bollinger Bands (Buy/Sell When Outside): This filter allows buy and sell signals when the price is outside the Bollinger Bands.
- PSAR (Above=Only Buy/Below=Only Sell): The Parabolic SAR (Psar) is a technical indicator used to provide potential reversal points in the price direction. It appears as dots either above or below the price chart, indicating potential trend changes. When below the price, it suggests an upward trend, and when above, it suggests a downward trend. This filter accepts buy trades when the price is above the Parabolic SAR (Psar) and sell trades when the price is below it.
- PSAR (Above=Only Sell/Below=Only Buy): This filter operates conversely, allowing only sell trades when the price is above the Psar and only buy trades when the price is below it.
Timeframe
Selecting a timeframe allows users to specify the timeframe for which trade filters should be applied. By selecting a particular timeframe, traders can customize the filtering process, ensuring a trend direction on a higher timeframe.
To apply a specific timeframe navigate to the Timeframe for Trade Filter option and select from the options available in the dropdown list.
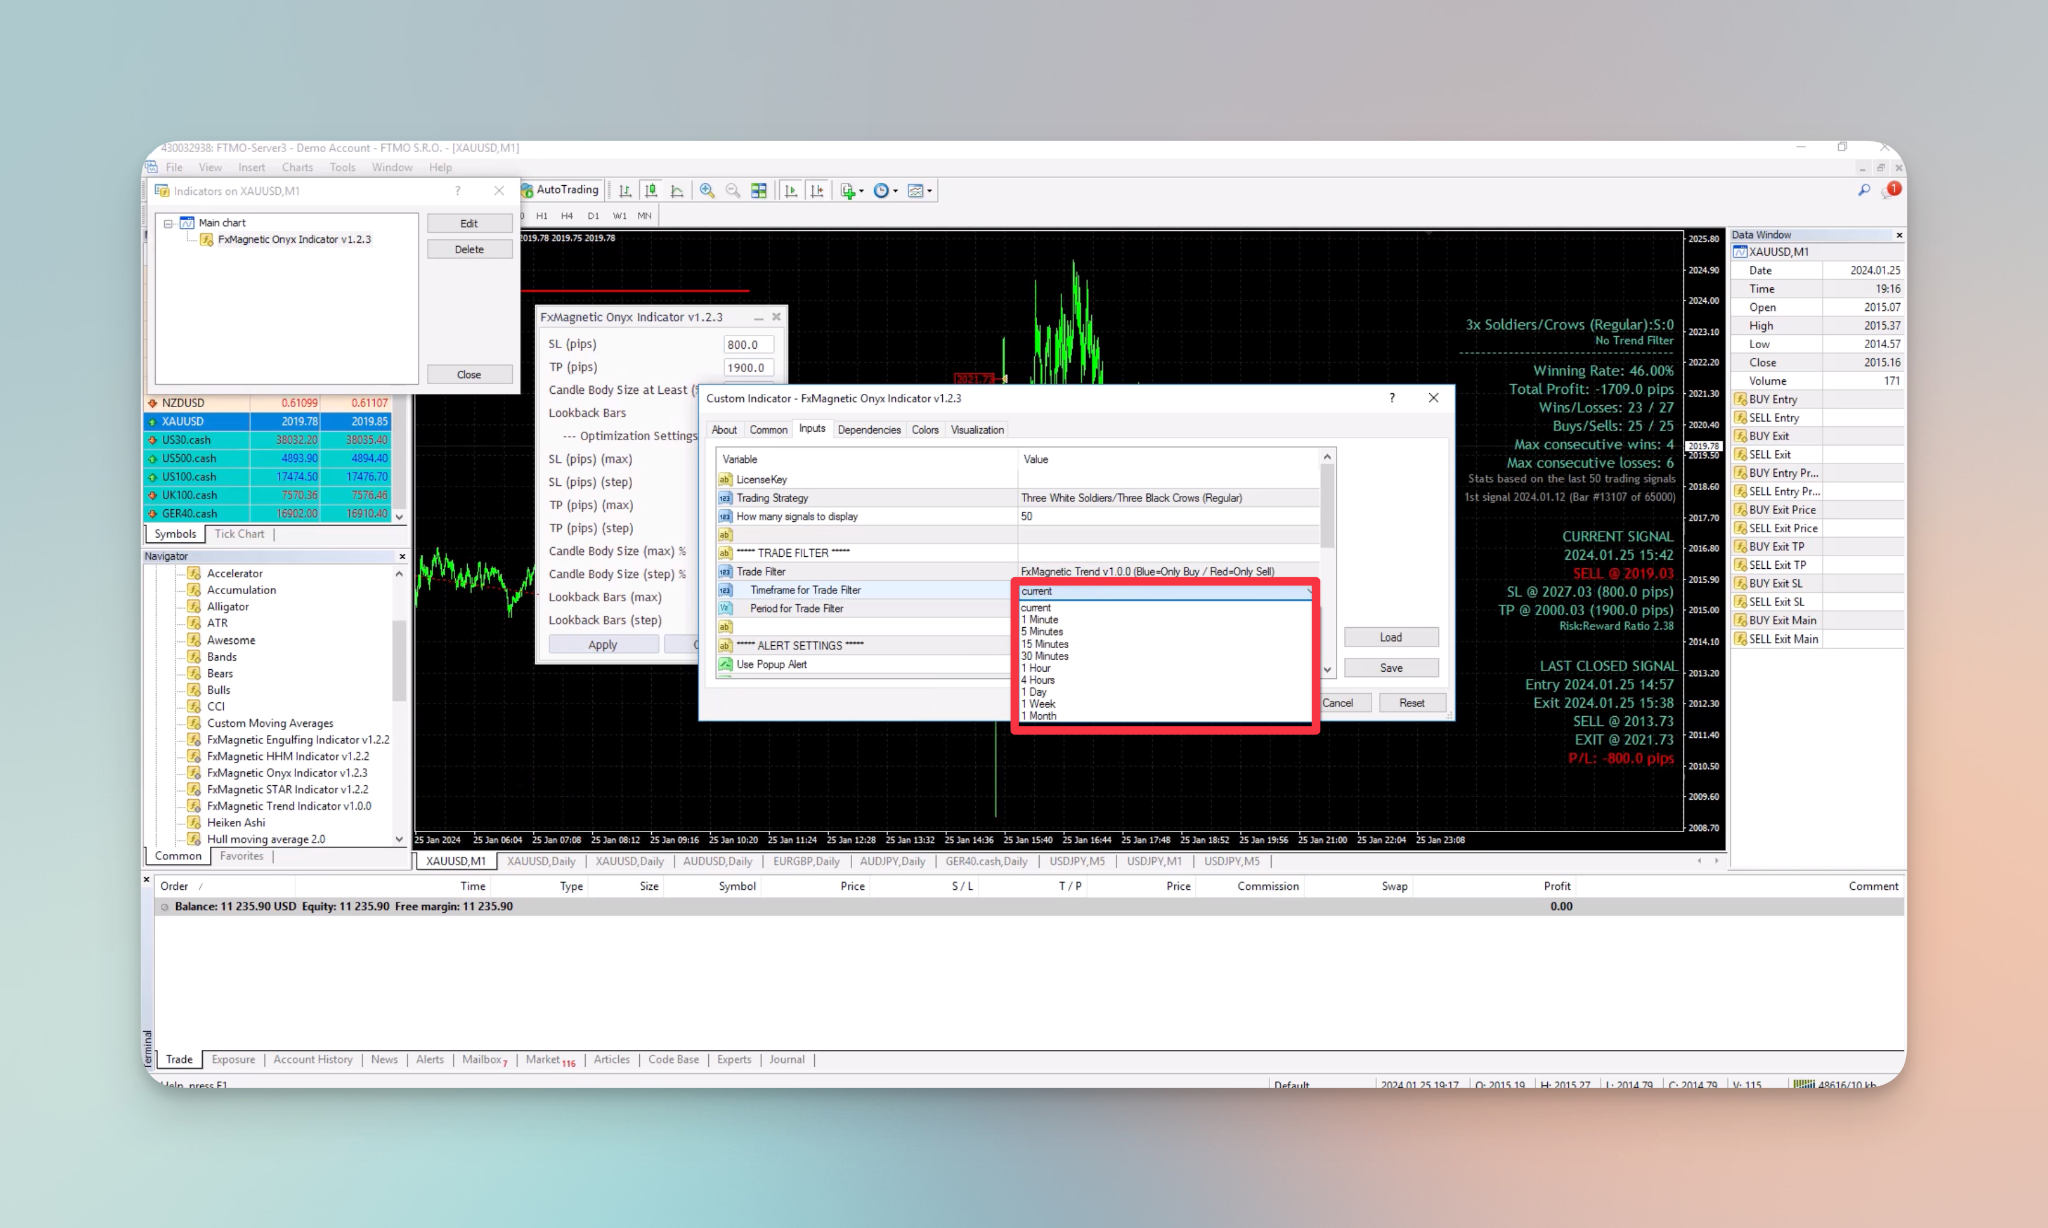
Following are your available options:
- Current
- 1 minute
- 5 minutes
- 15 minutes
- 30 minutes
- 1 hour
- 4 hours
- 1 day
- 1 week
- 1 month
Period for Trade Filters
Period for Trade Filters refers to a user-defined parameter that influences how the trade filters operate. This setting represents a variable that traders can adjust to customize the behavior or sensitivity of the trade filter. Traders can refine the filter’s criteria to align with their preferences and trading strategy by adjusting this setting.
Imagine a period for the Moving Average. If you input 10, you get MA based on the last 10 bars. If you input 100, you get MA based on the last 100 bars. So it’s kind of very similar for the FxMagnetic Trend period as well.
To modify the trade filter period, go to the “Period for Trade Filter” option and adjust the setting based on your preferences.
Demonstration
Let’s see how the Trade Filters work in real time:
No Trade Filter
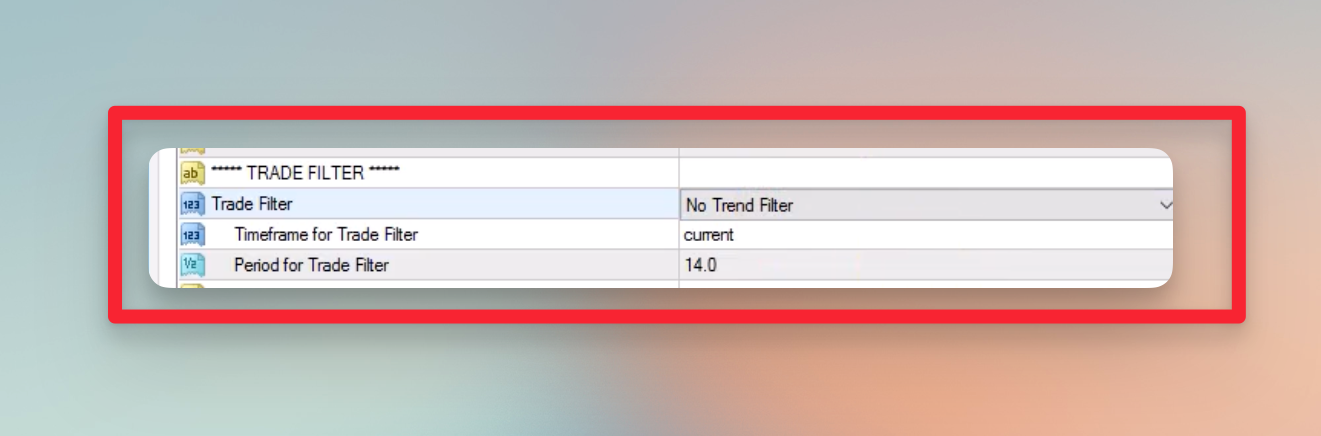
For this demonstration, “No Trend Filter” is selected. Selecting “No Trend Filter” means the Scanner (indicator) will not use any Trend Filter and will also ignore timeframe and period variables, which will have no effect.
Settings:
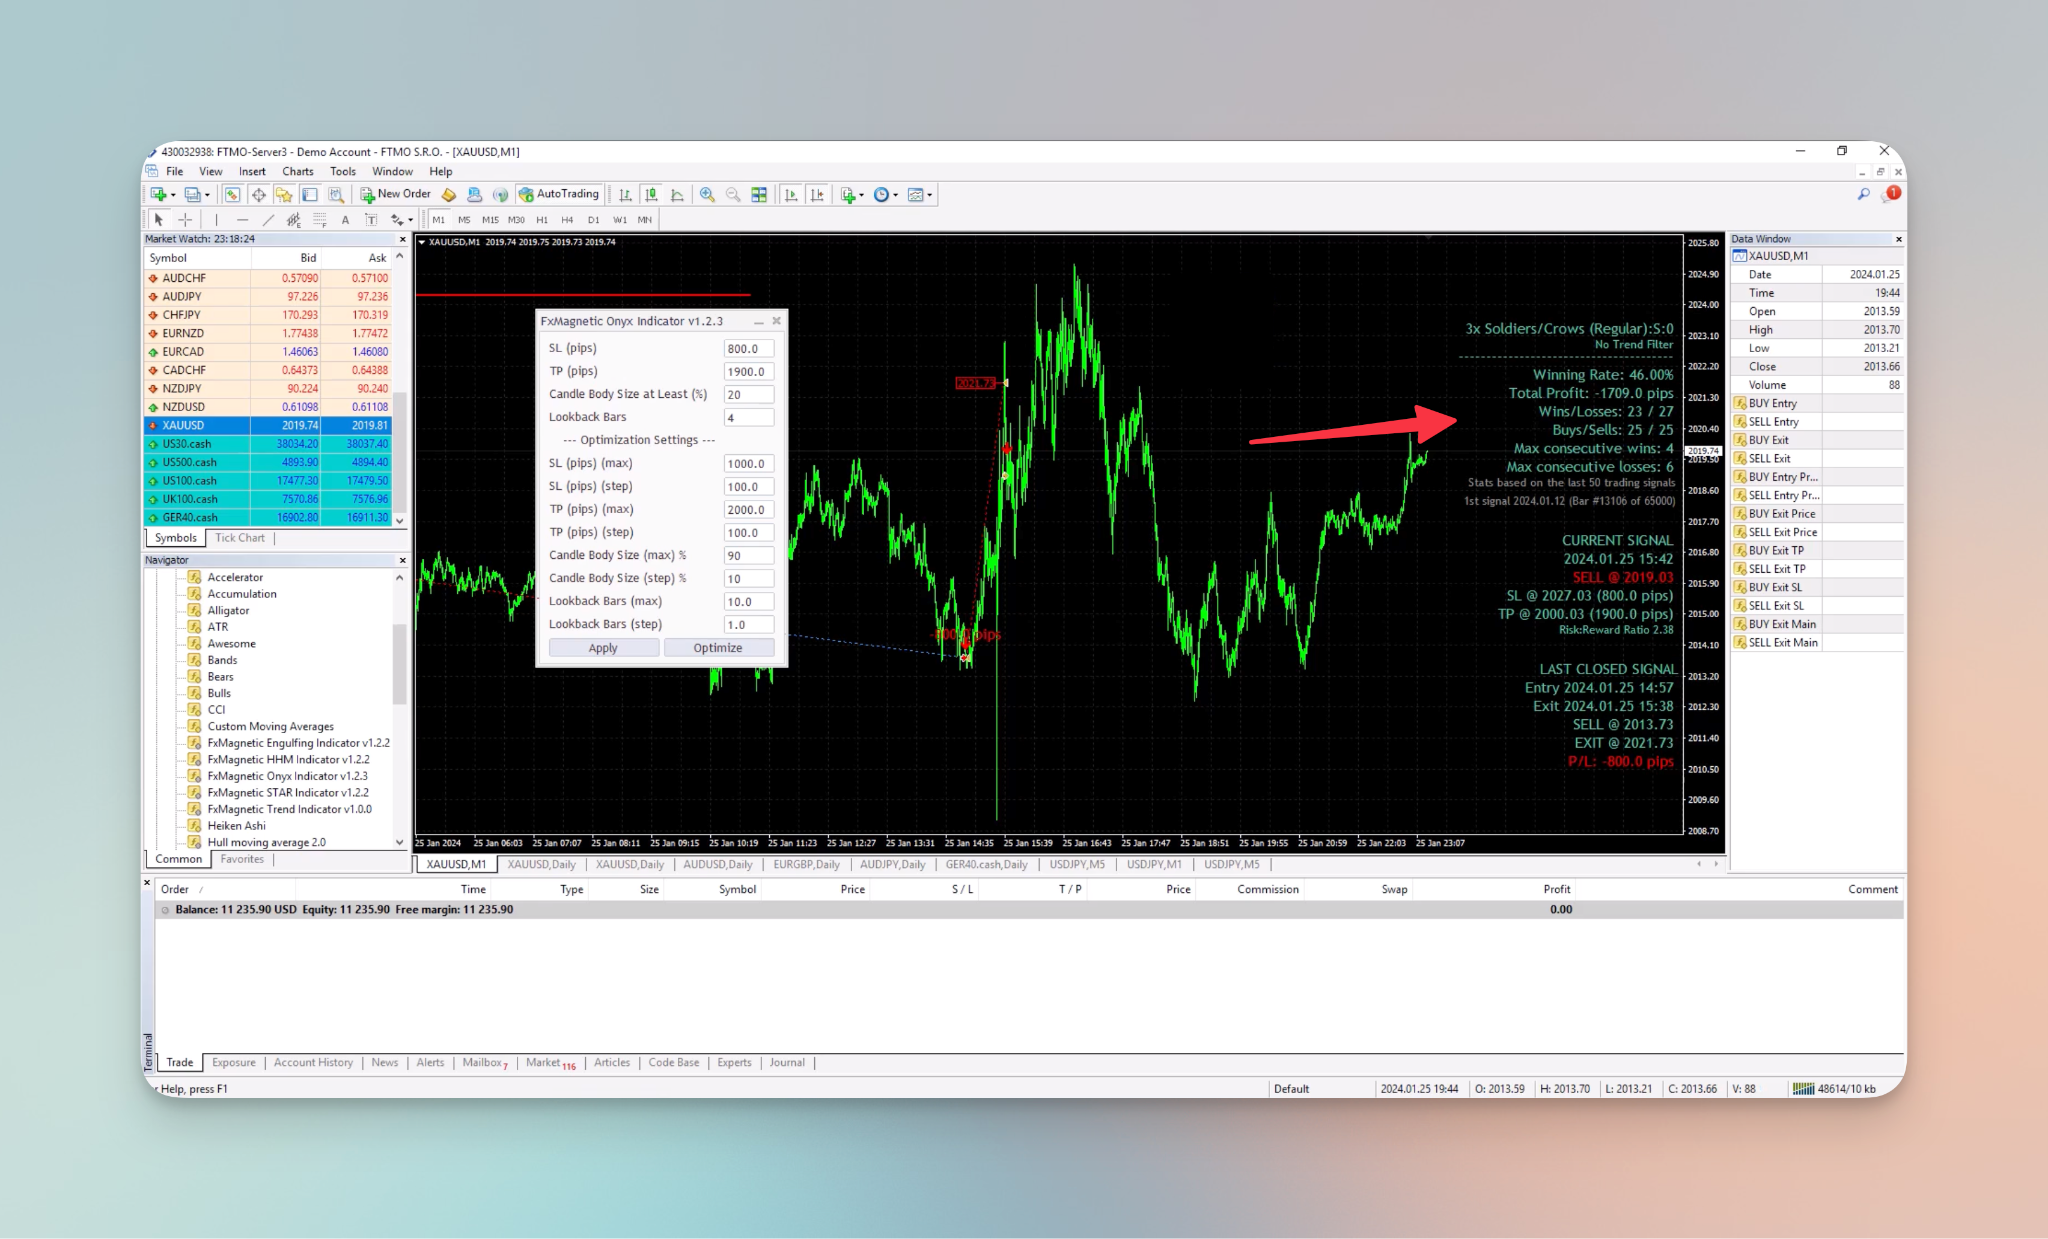
Results:
FxMagnetic Trend
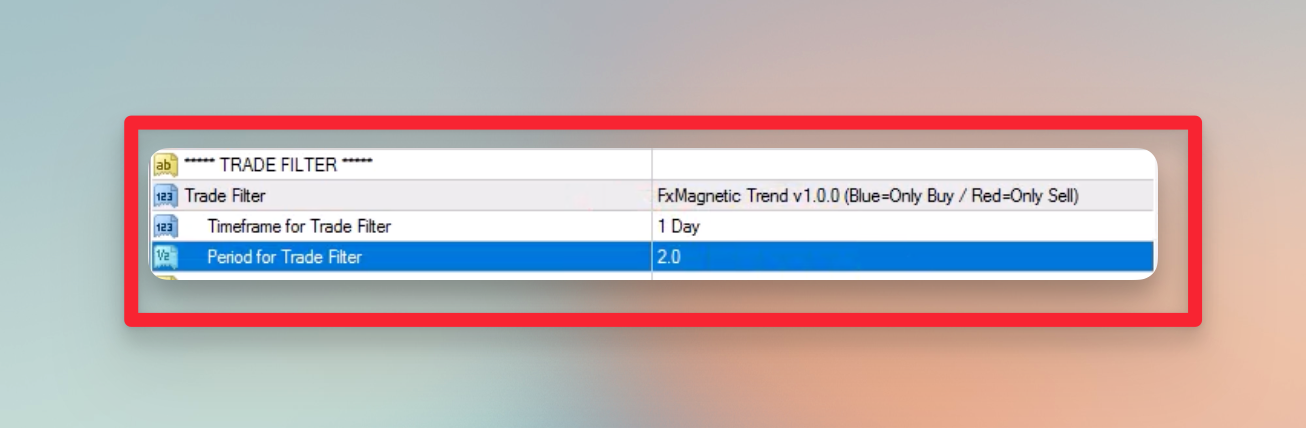
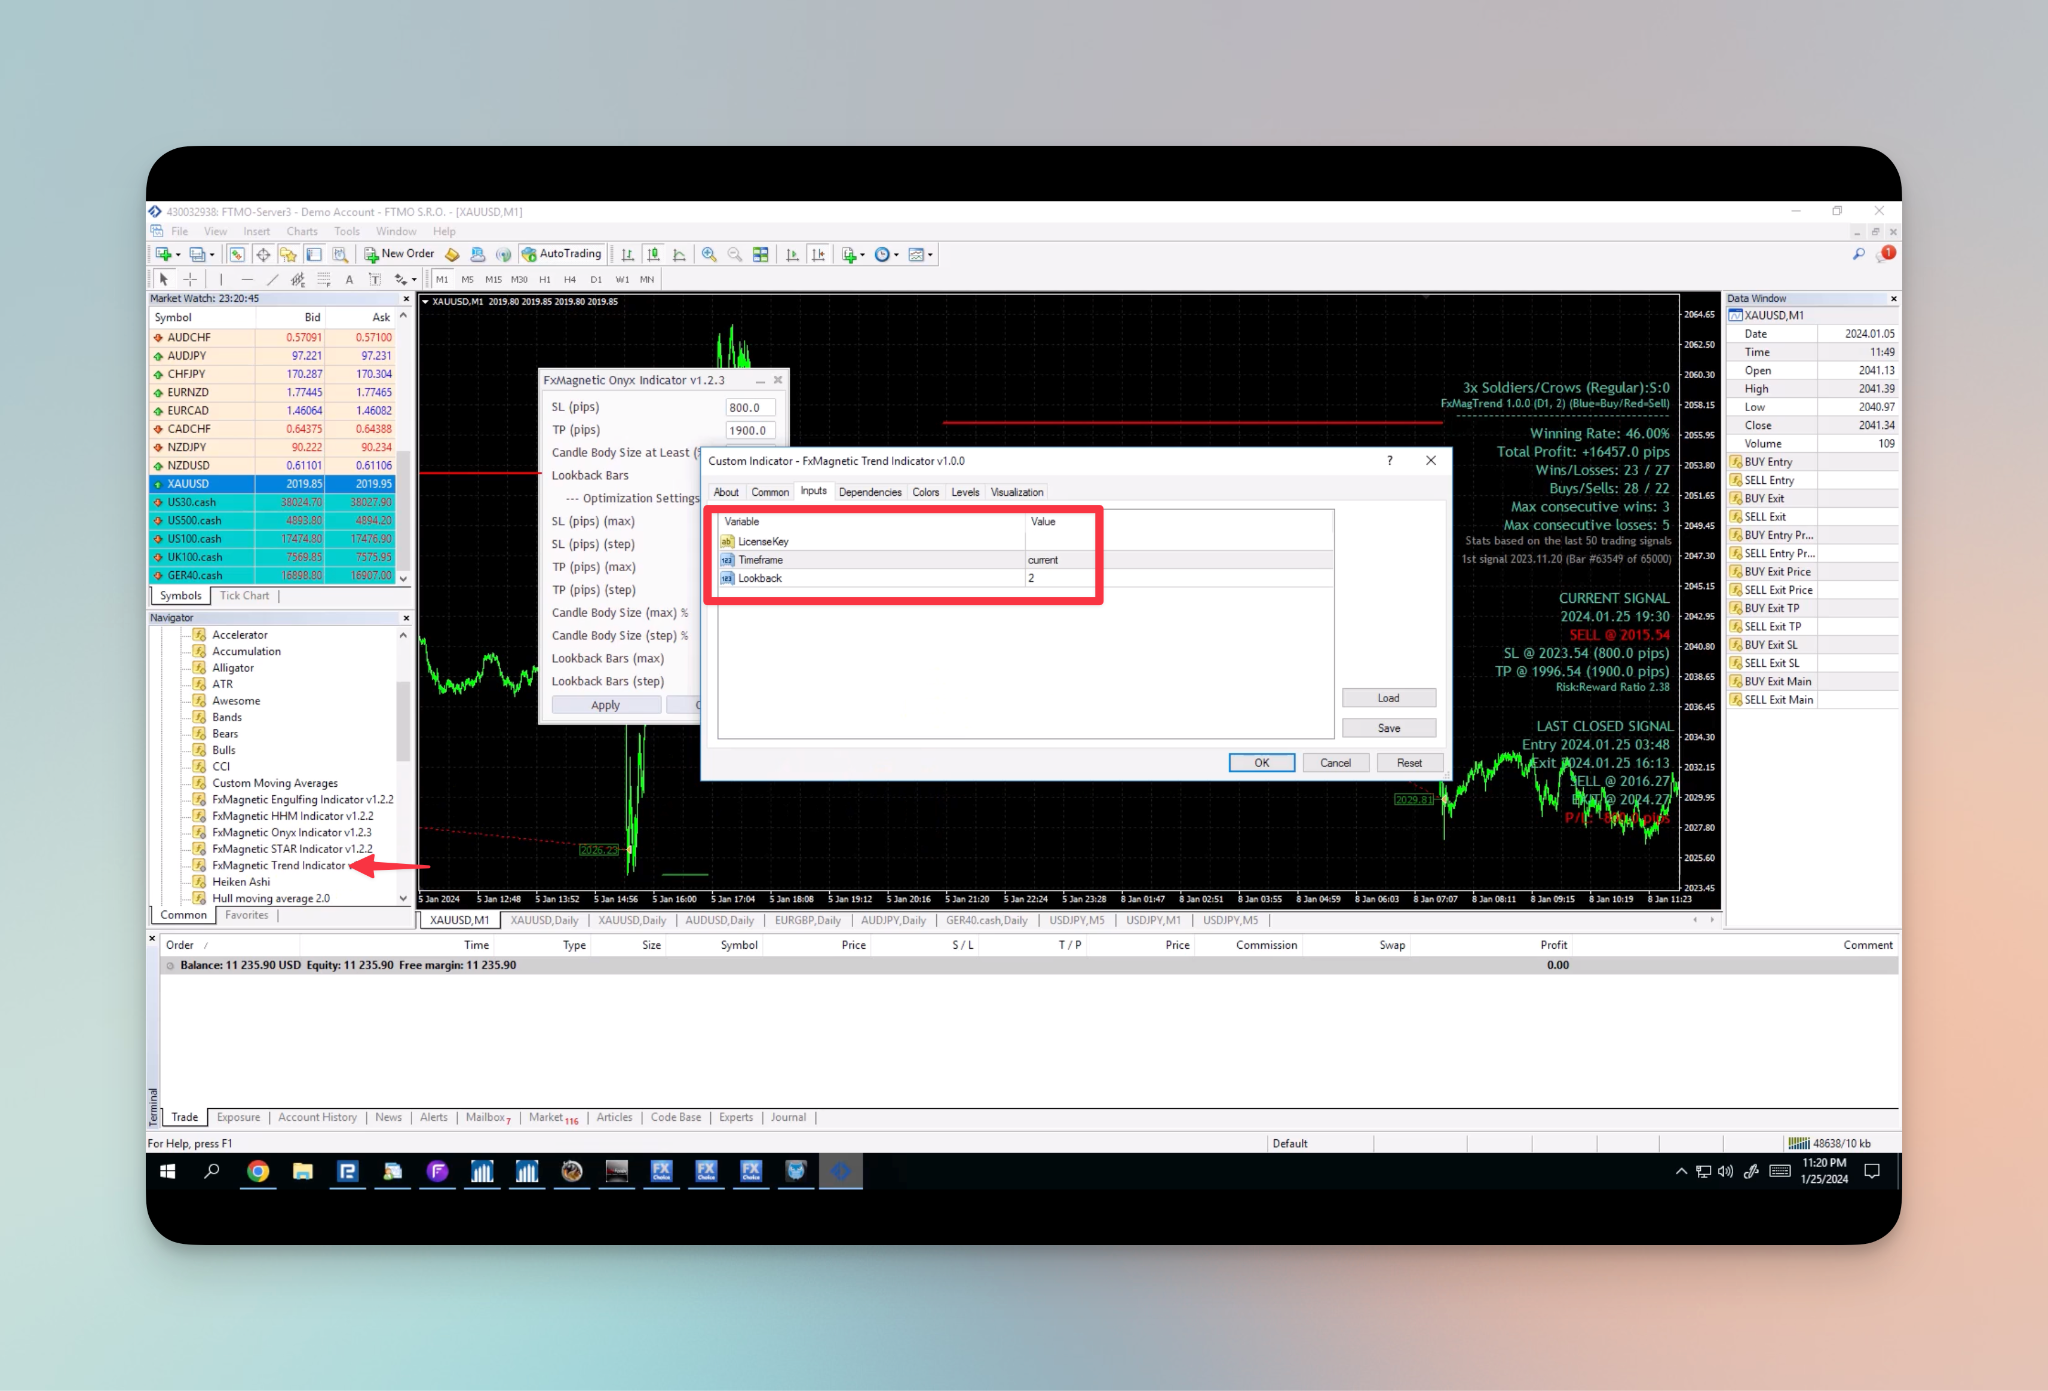
In this demonstration, the FxMagnetic Trend V1.0.0 filter is applied, and the filter settings are set to use a 1-day timeframe. Additionally, the period of the trade filter has been set to 2.
Settings:
Results:
Using the trade filter helps the indicator decide when and where to trade. Combining the Onyx and FxMagnetic Trend indicators helps manage trades better and avoid exiting too soon. Setting the timeframe and period for the FxMagnetic Trend keeps a good winning rate. With this, the Fxmagnetic Onyx indicator finds better trade directions, avoiding leaving trades too early. In other words, the FxMagnetic Onyx indicator ensures trend direction on a higher timeframe with the FxMagnetic Trend indicator and only takes trades in that direction. Some trades might close early due to changes in trends, but overall, the result is positive because of big take-profit trades, leading to more pip gains.
As you know, FxMagnetic always exits trades earlier if we get an opposite signal if it’s set to scan for BUY and SELL trades (Regular or Reverse strategies). You’ll notice this behavior without a Trend filter or a Trend filter with a small period.
If you set the Trend filter to be applied to a higher timeframe (or the same timeframe but a high period value), naturally, what happens is that FxMagnetic will be forced to scan only for BUY or SELL trades for an extended period and ignore the opposite signals. Imagine the price being above the Daily Trend filter for 3 months. That will force FxMagnetic to look for BUY trades only and ignore any SELL trades, meaning it will not exit BUY trades earlier during this period.
FxMagnetic Trend Indicator
To observe the Onyx indicator’s function, drag and attach the trend indicator to the chart with the same settings used for selecting the filter. Navigate to Inputs, and set the timeframe to 1 day, and the lookback to 2.
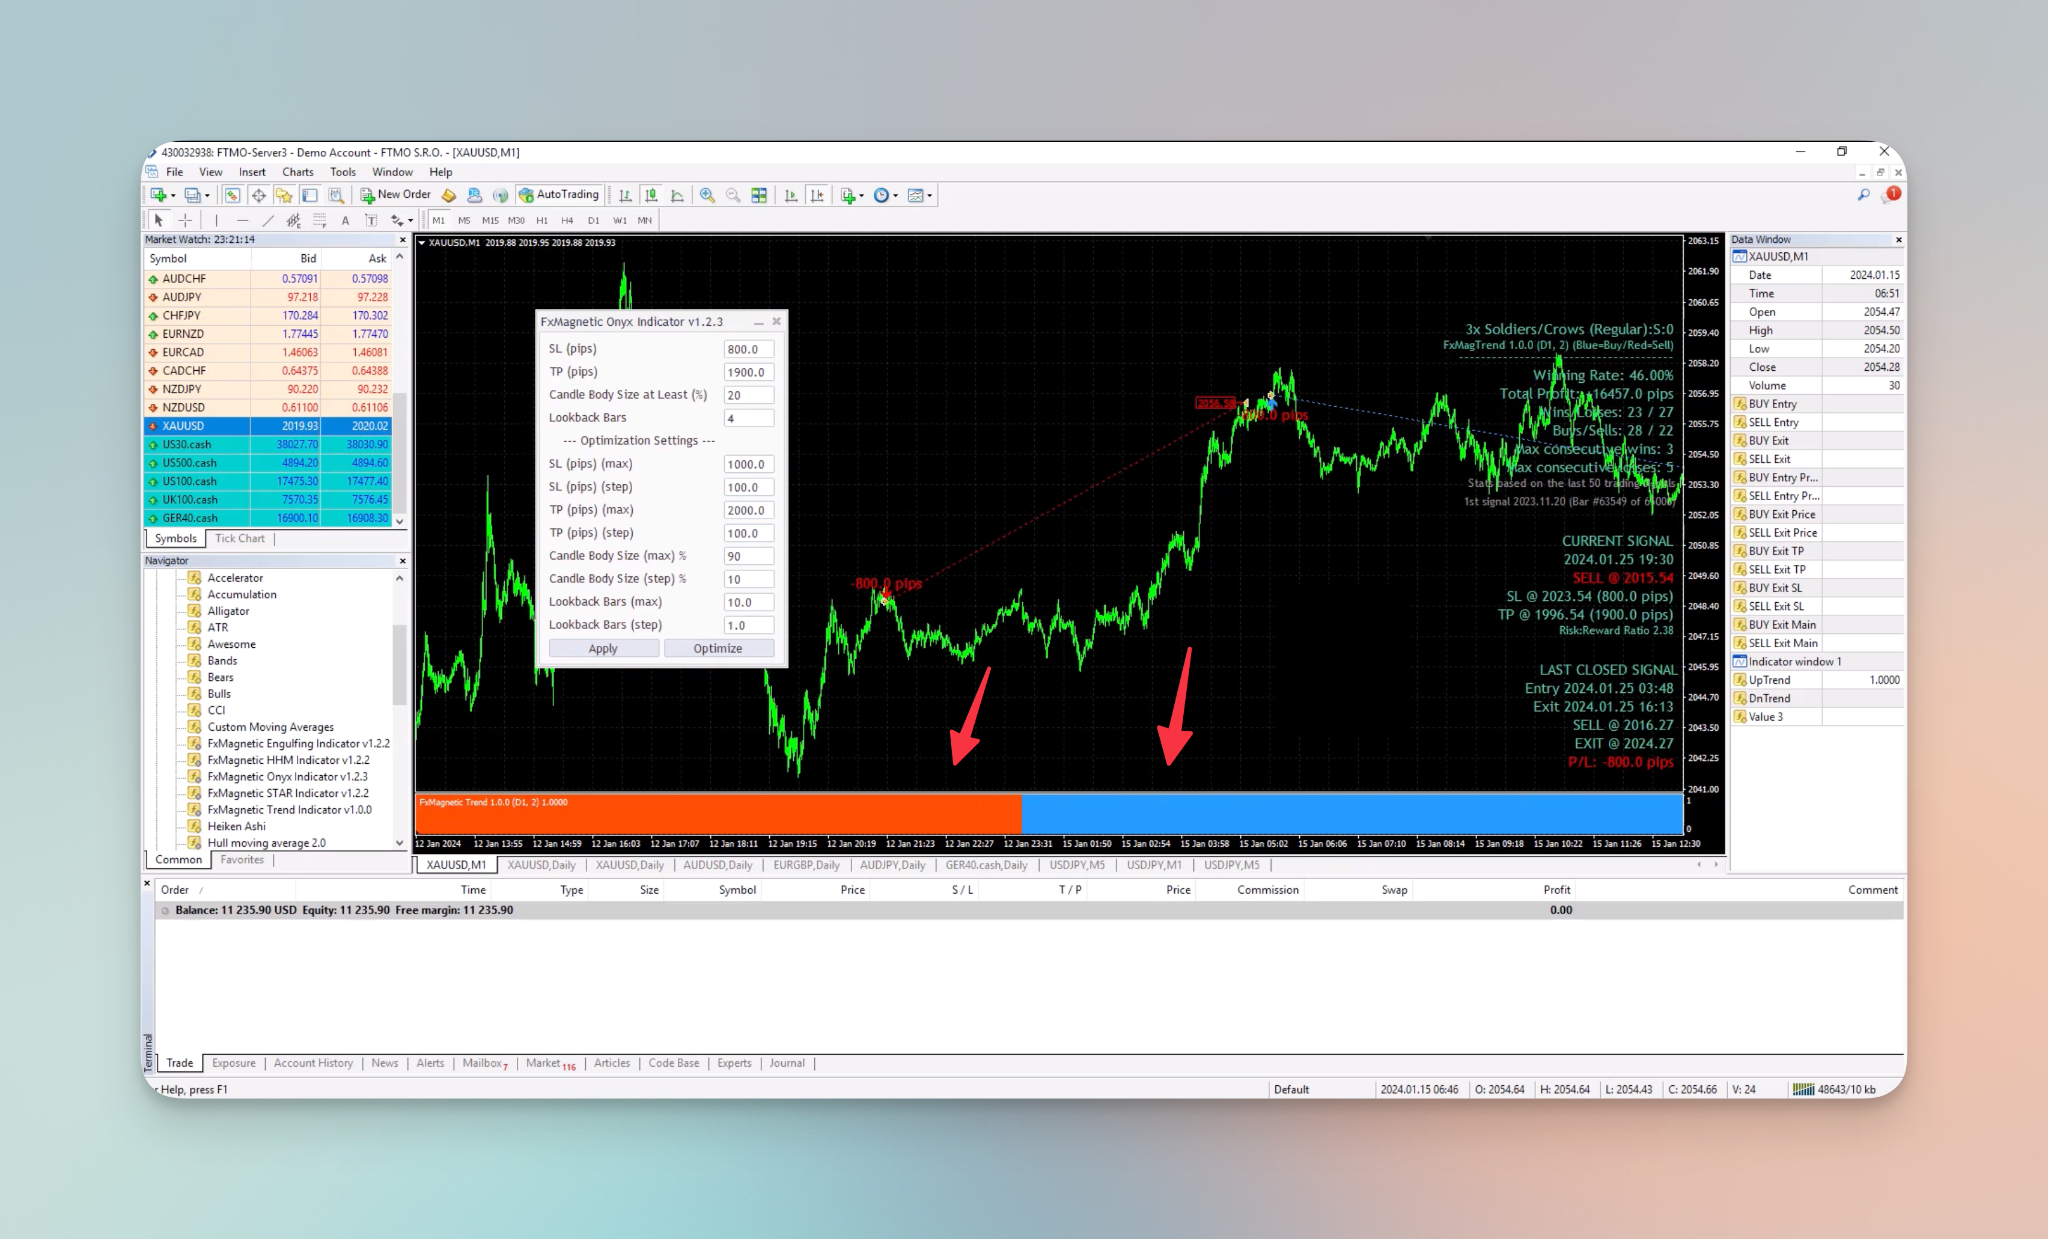
If the bottom of your chart appears red, it means the indicator is only looking for a Sell trade, and on the other hand, if it’s blue then the indicator is only looking for a Buy trade. During the sell trade, you won’t see any buy trade until you enter one.
Bollinger Bands
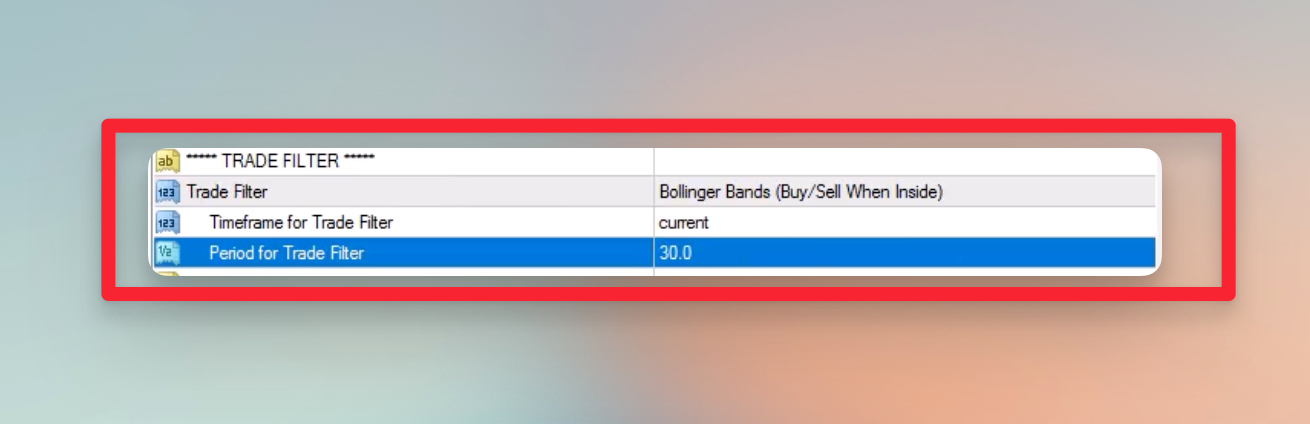
For the Bollinger Bands filter, after selecting the filter, the timeframe is set to current, and the period is set to 30.
NOTE: Bollinger Bands have two additional parameters, but here we can control only the Period. The other parameters always stay default where the Bands width is 2.0 and the Price applied to is “Close price”.
The results may not look good initially, but you can use optimization for better results.
To view the bands:
- Click the Indicator list Icon
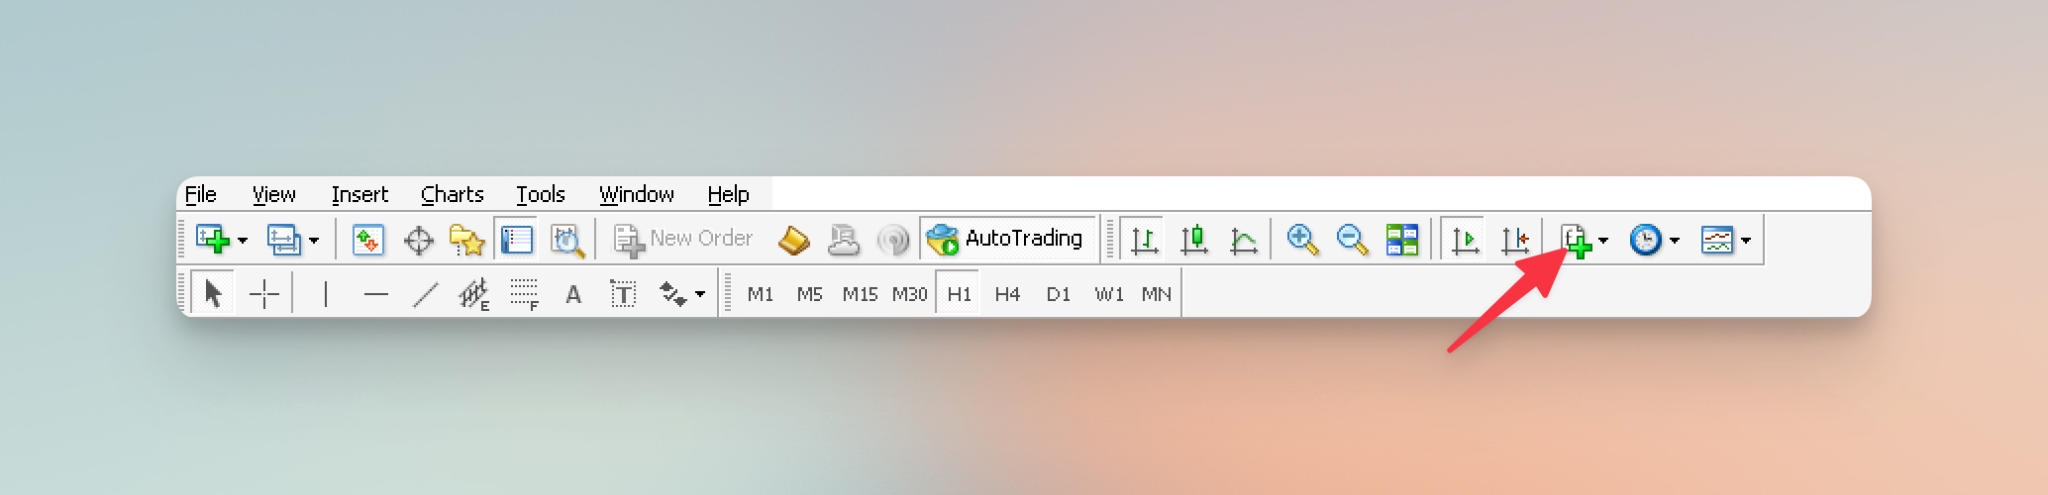
- Go to “Trend,” and select “Bollinger.”
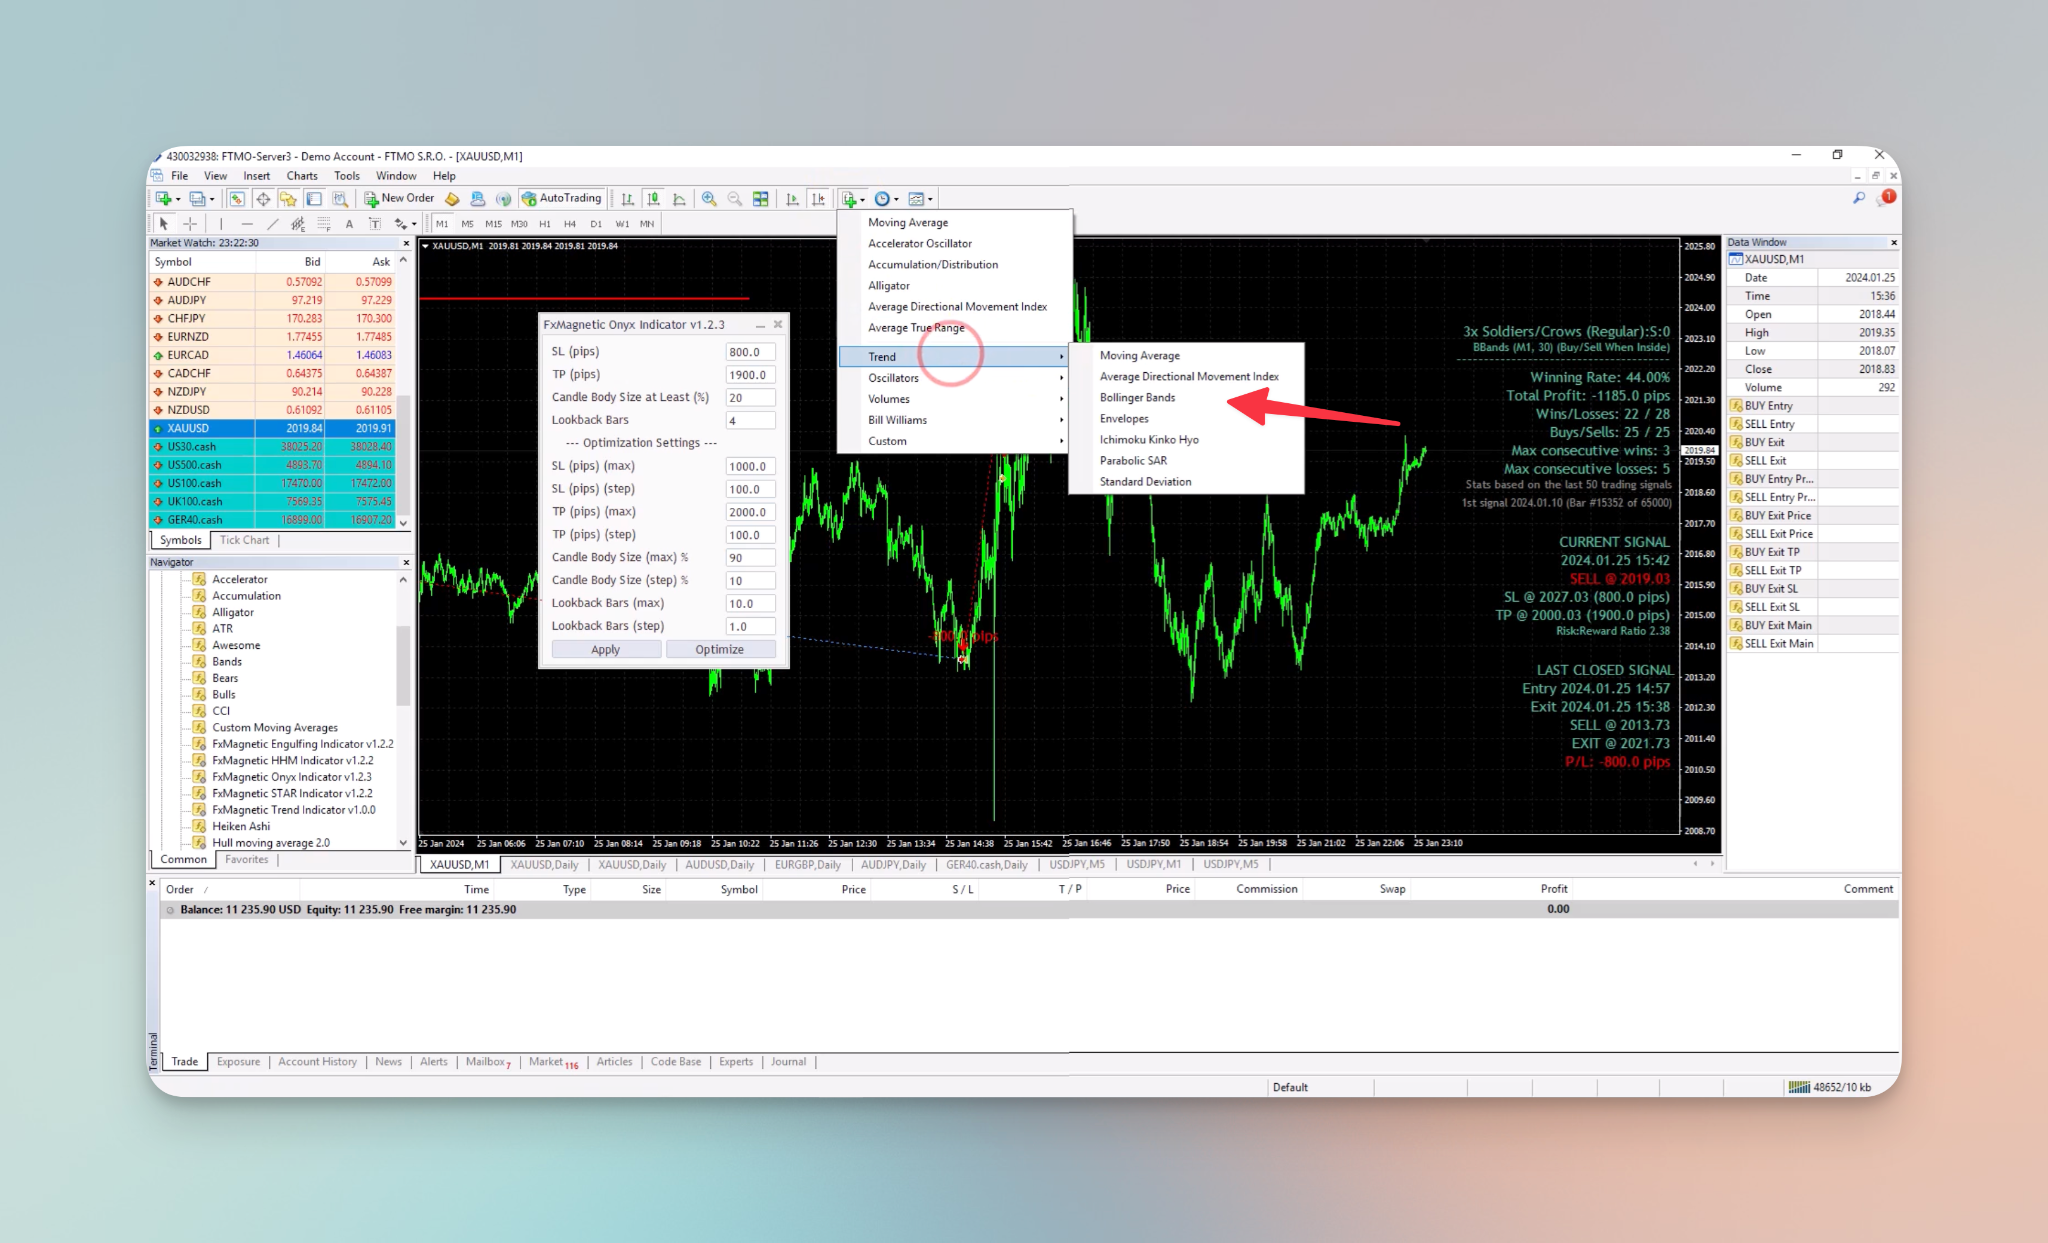
From the Parameters section set the period to 30, keep deviations at 2. You can also select from the different styles.
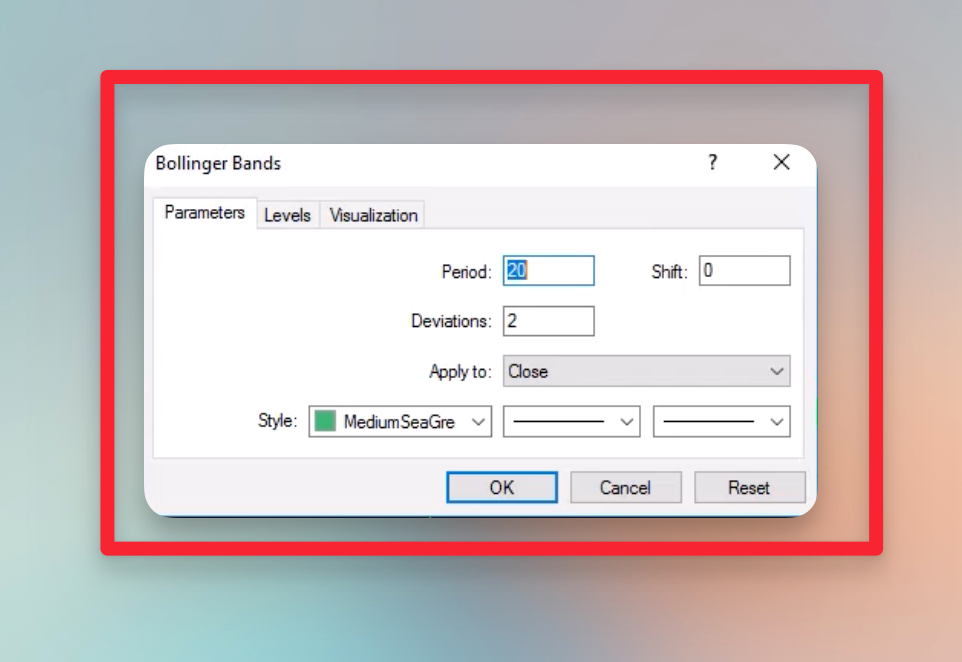
The strategy is to buy and sell only within the Bollinger Bands, ensuring signals are inside the bands. Opting for the reverse strategy gives signals when patterns appear outside the bands.
Note: Removing the indicator doesn’t impact Onyx’s trend filter as it operates behind the scenes.
Simple Moving Average
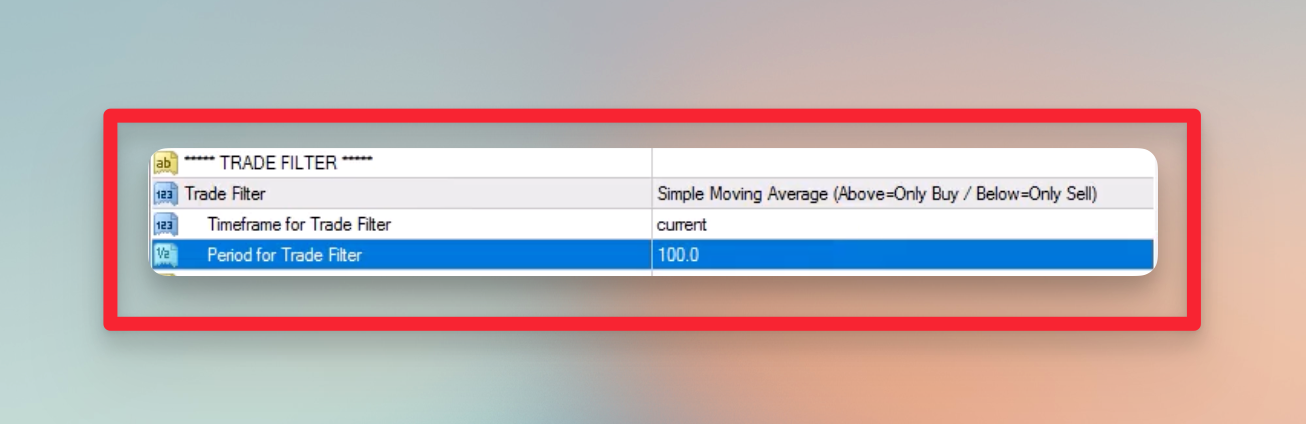
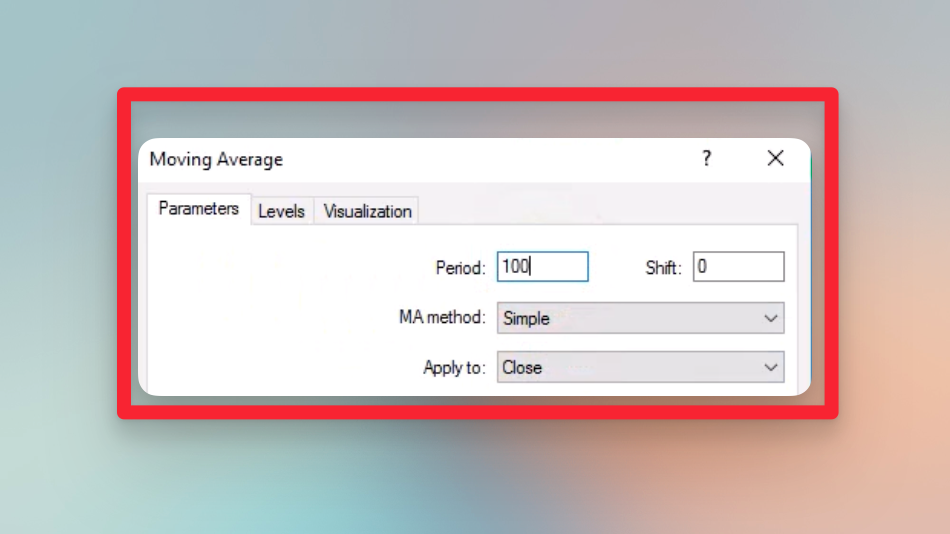
After selecting the Simple Moving Average trade filter, the timeframe is set to current, and the period is set to 100.
If you want the visual representation of this filter:
- Go to the Indicator list icon

- Then, go to Trend and select Moving Average.
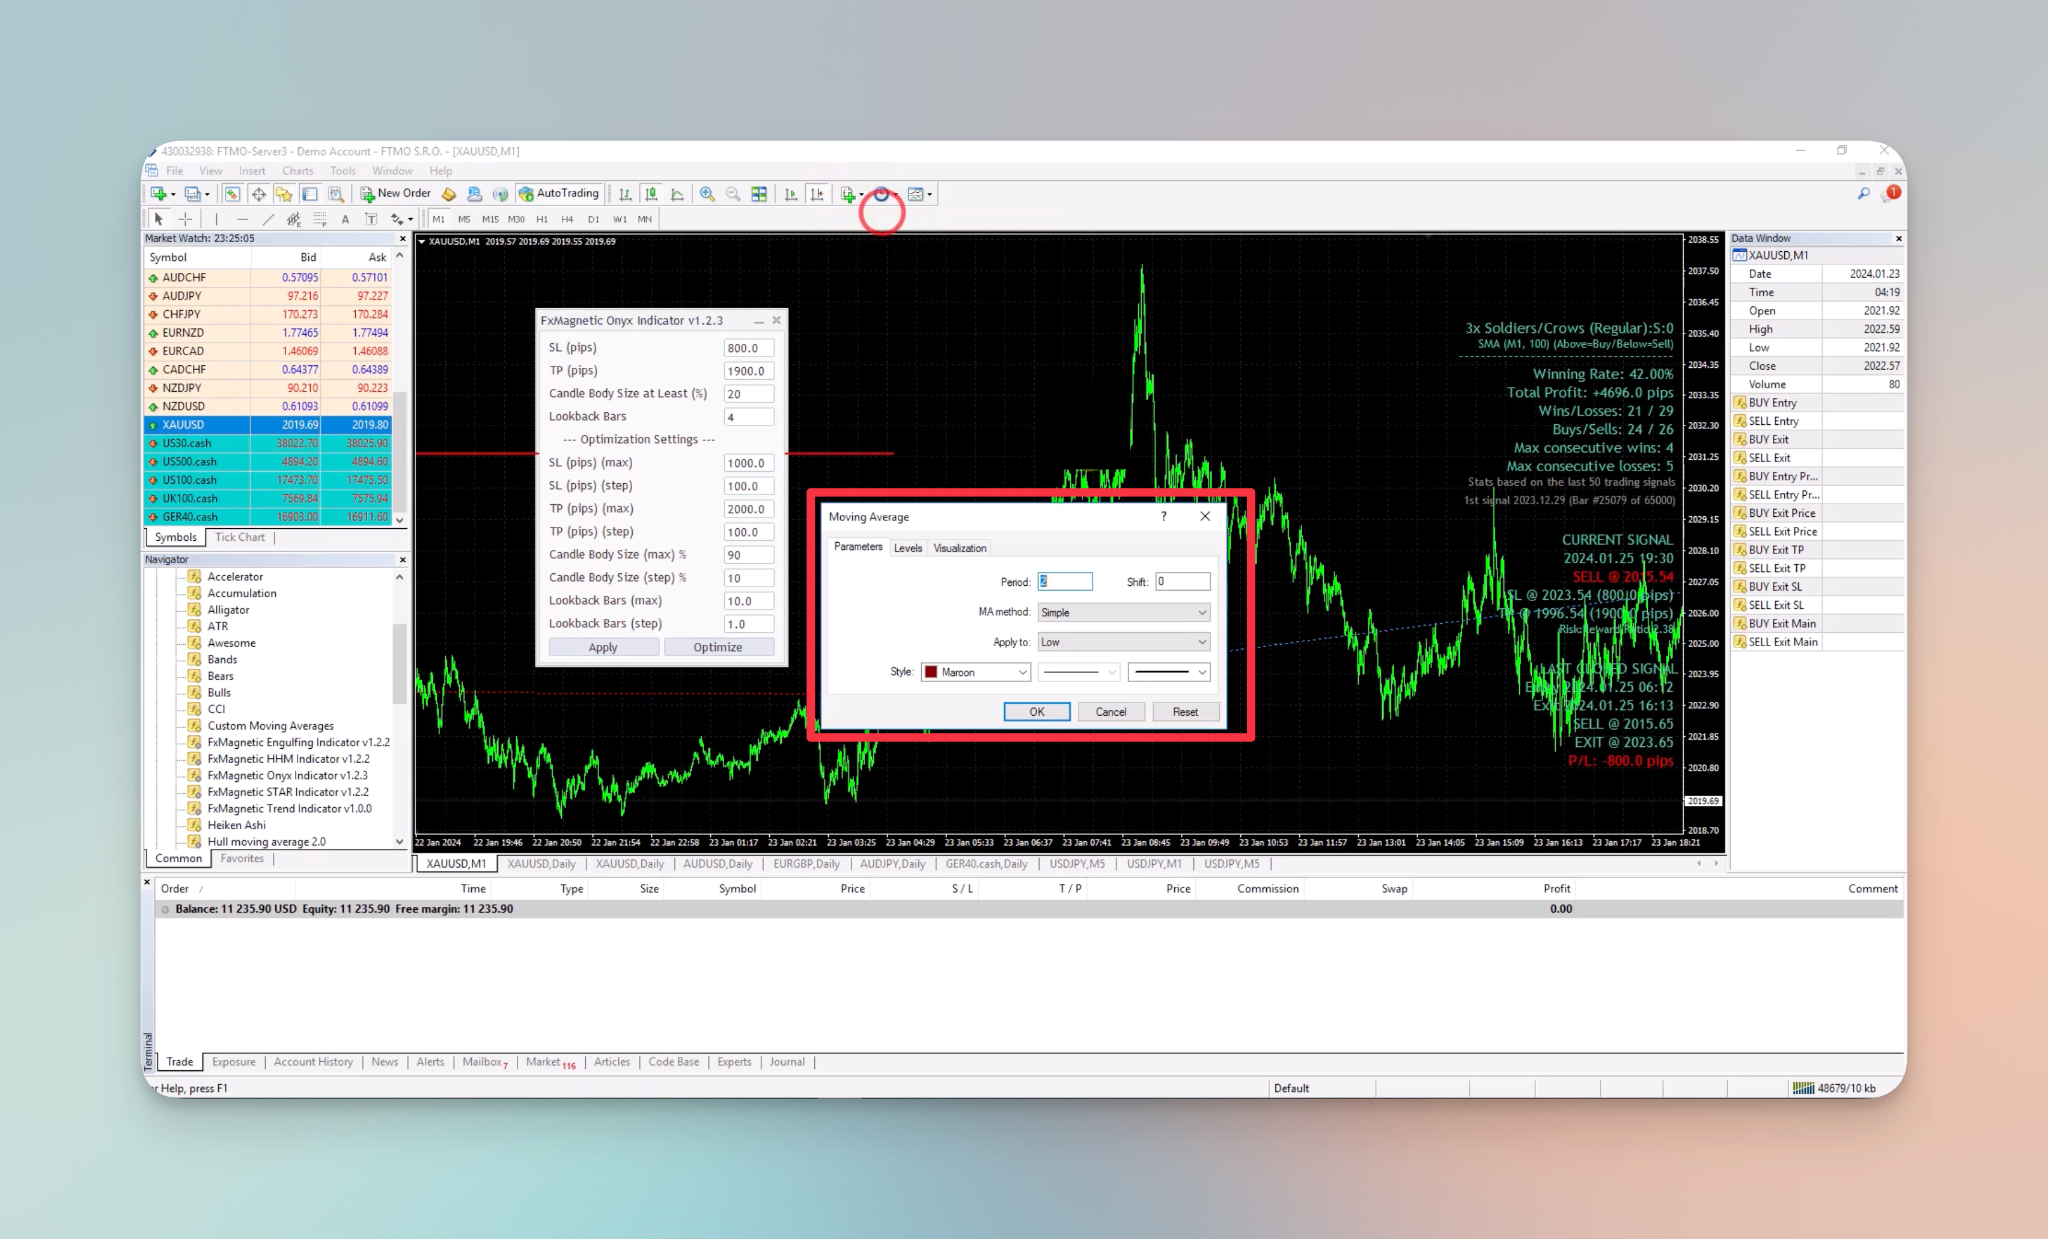
- From the Parameters section, set the period to 100.
Note: To use the Moving Average (MA) method correctly, select “Simple” for a visual representation of the Simple Moving Average trade filter. On the other hand, if you opt for the Exponential Moving Average as your trade filter, choose “Exponential” as the MA Method for the visual representation.
Prices above the moving average will allow a buy signal and prices below will allow a sell trade signal. If the price is above the simple moving average and there is a sell signal Onyx will disregard it according to the selected filter.
Wrapping Up
Trade filters optimize signals according to specific strategies. You can choose from various filters and adjust the settings tailored to your approach. By using these trade filters you can filter out trades and adjust trade direction accordingly. Experiment with various filters before settling on one for a more effective approach!