
In this guide, we introduce the various candlestick patterns and trading styles, with a specific focus on the FxMagnetic Indicator. This guide is designed for beginners and intermediate traders looking to build foundational knowledge of candlestick patterns and the various trading styles.
Pre-requisites
Before we dive in, ensure you have the Meta Trader 4 (MT4) and the FxMagnetic Indicators installed and set up. Although it is not mandatory, it would be useful to have a basic understanding of the Parameter Optimization Matrix to make use of the various trading styles. You can refer to our guides on these topics:
Understanding Candlesticks
Candlesticks are a charting tool in trading, helping to show how prices move. They give a quick picture of what’s happening in the market. Each candlestick looks like a rectangle (the main part) with lines sticking out from the top and bottom (the wicks). These parts give you clues about how the market moved in a certain period.
Candlestick Anatomy
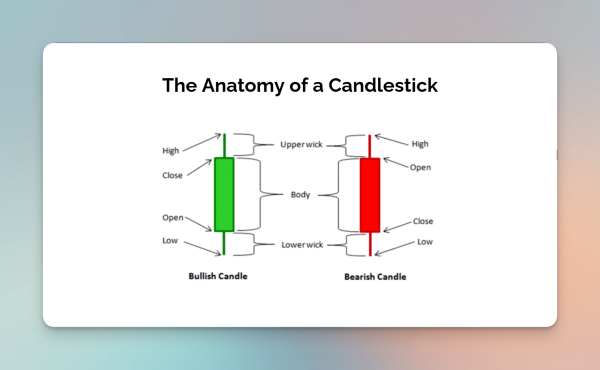
The color and filling of a candlestick tell you quickly about the market’s mood. A filled candlestick, usually red or black, means prices went down. This is called a Bearish Candle, showing that more people were selling. A candlestick that’s empty or light-colored, often green or white, means prices went up. This is a Bullish Candle, showing more buying.
The body of the candlestick shows the opening and closing prices. The wicks show the highest and lowest prices in that period. Together, they tell the story of how the market moved, like whether buyers or sellers were stronger.
Timeframes and Candlesticks
Timeframes are crucial in candlestick charting. Each candlestick represents a certain amount of time, and the timeframe you choose changes how you see market trends. For example, a candlestick on a D1 (one day) chart shows a whole day’s data, while a 1M (one minute) chart gives quick, detailed updates.
Longer timeframes like weekly or monthly (W1, MN) show bigger market movements and are seen as more important. Shorter timeframes (like M1 or M15) show more patterns but can be less reliable because of market noise and quick changes. Understanding these timeframes helps traders see market trends and guess future movements better.
Candlestick Patterns
Candlestick patterns are a way to see how the market might move next. They are made by looking at the shapes formed by one or more candlesticks. Each pattern is based on the prices at the start, highest point, lowest point, and end of a certain time. These patterns are important for traders to understand the market.
Traders look at these patterns to figure out what the market is feeling. A clear pattern can mean a big change is coming or it’s better to stay as is. Understanding these patterns helps traders make better decisions. They use this to guess what prices might do next, based on what prices have done before.
Here’s a list of the most common candlestick patterns:
-
Morning Star
-
Evening Star
-
Inverted Hammer
-
Shooting Star
-
Hammer
-
Hanging Man
-
Bullish Engulfing
-
Bearish Engulfing
Morning Star Pattern
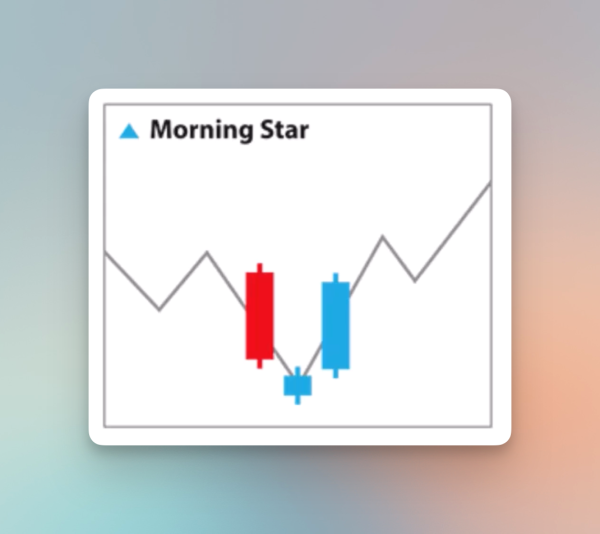
The Morning Star pattern signals a possible bullish reversal during a downtrend. It consists of three candles: a bearish candle, a smaller-bodied candle, and a bullish candle. The key is the third candle, which should rise and cover at least half of the first candle’s body. This indicates a potential shift from a downward to an upward trend.
Characteristics:
Forecast: Suggests a bullish reversal.
Appearance: Typically found in a downtrend.
Opposite: Evening Star, a bearish reversal pattern.
Evening Star Pattern
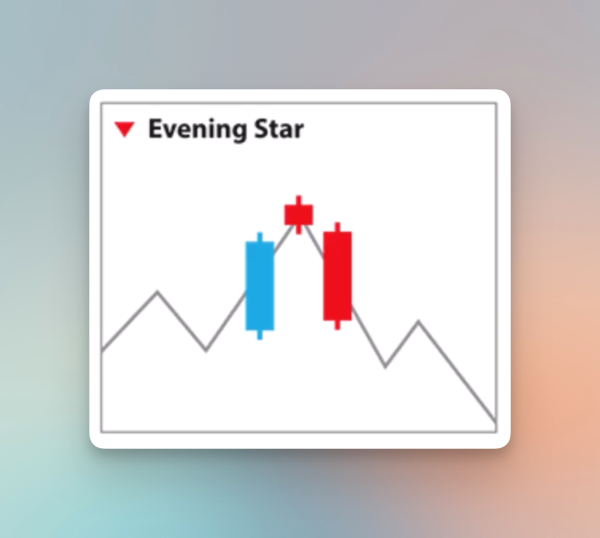
The Evening Star pattern is a bearish reversal signal, opposite of the Morning Star. It appears during an uptrend and includes a bullish candle, a smaller candle, and a bearish candle that falls, covering at least half of the first candle’s body. This suggests the bullish trend may be weakening, and a downward trend could start.
Characteristics:
Forecast: Indicates a bearish reversal.
Appearance: Found in an uptrend.
Opposite: Morning Star, a bullish reversal pattern.
Inverted Hammer Pattern
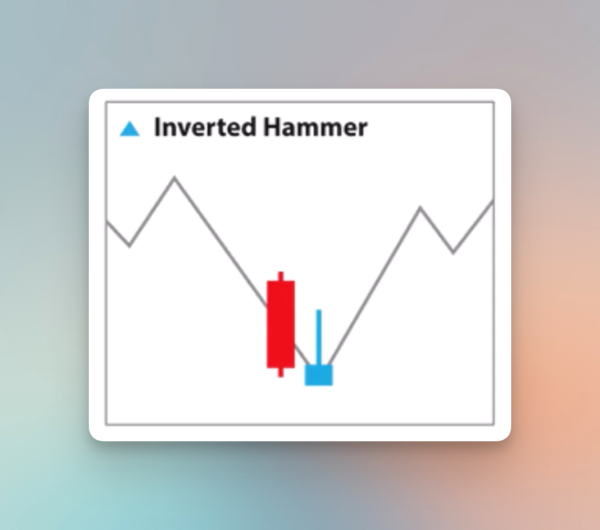
The Inverted Hammer is a single candlestick pattern indicating a bullish reversal at the end of a downtrend. It has a small body with a long upper wick and little or no lower wick. This suggests that buyers pushed prices up, but they retreated by the close, indicating a potential upcoming trend reversal.
Characteristics:
Forecast: Bullish Reversal.
Appearance: Found at the end of a downtrend.
Opposite: Shooting Star, a bearish reversal indicator.
Shooting Star Pattern
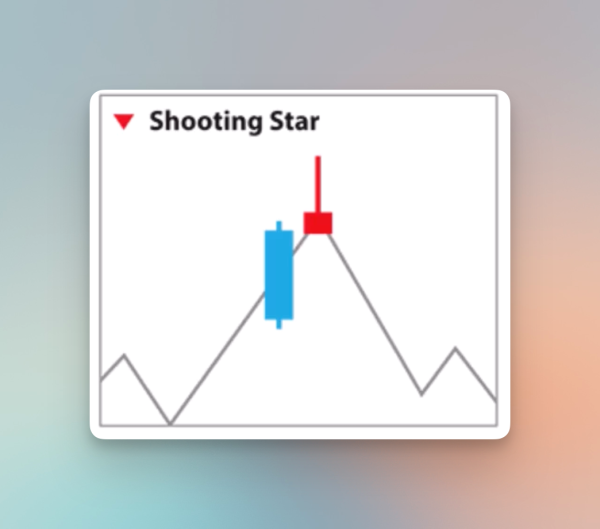
The Shooting Star, similar to the Inverted Hammer but in an uptrend, signals a potential bearish reversal. It has a small body with a long upper wick, indicating buyers lost control after initially pushing the price up. This suggests bearish forces may lead to a downward price movement.
Characteristics:
Forecast: Bearish Reversal.
Appearance: Found at the end of an uptrend.
Opposite: Inverted Hammer, indicating a bullish reversal.
Hammer Pattern
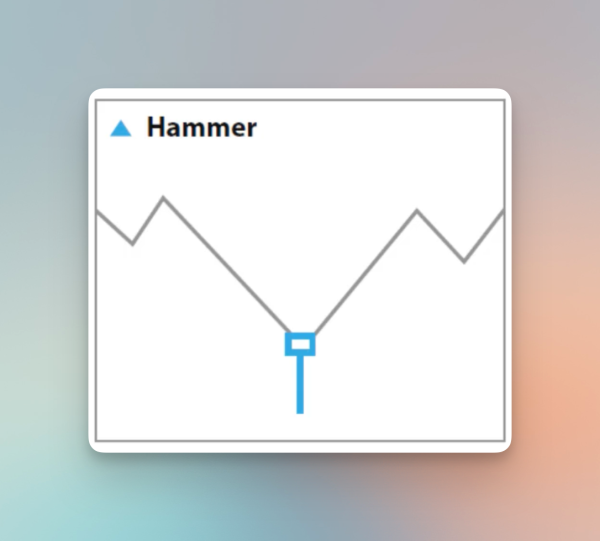
The Hammer pattern, typically seen at the end of a downtrend, suggests a potential bullish reversal. It looks like a hammer with a small body at the top and a long lower shadow, indicating buyers overcame selling pressure. This suggests the downtrend might be ending.
Characteristics:
Forecast: Possible Bullish Reversal.
Appearance: Seen during a downtrend.
Opposite: Hanging Man, a bearish reversal pattern.
Hanging Man Pattern
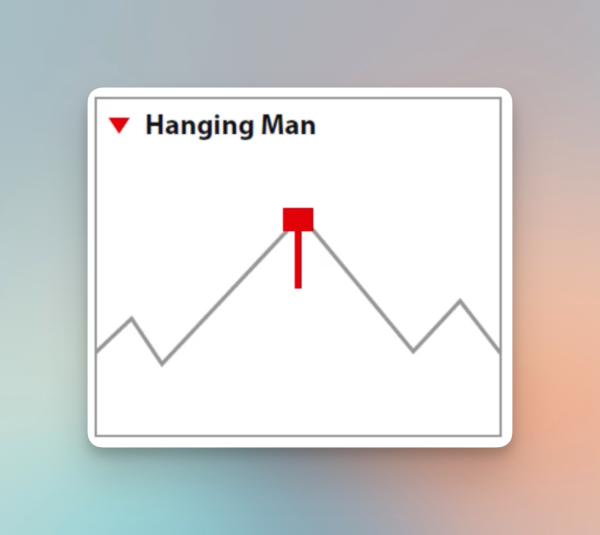
The Hanging Man pattern, appearing at the top of an uptrend, is similar in shape to the Hammer but suggests a bearish reversal. The long lower shadow shows selling pressure overcoming buying pressure, indicating the uptrend may be weakening.
Characteristics:
Forecast: Possible Bearish Reversal.
Appearance: Seen at the top of an uptrend.
Opposite: Hammer, indicating bullish reversal tendencies.
Bullish Engulfing Pattern
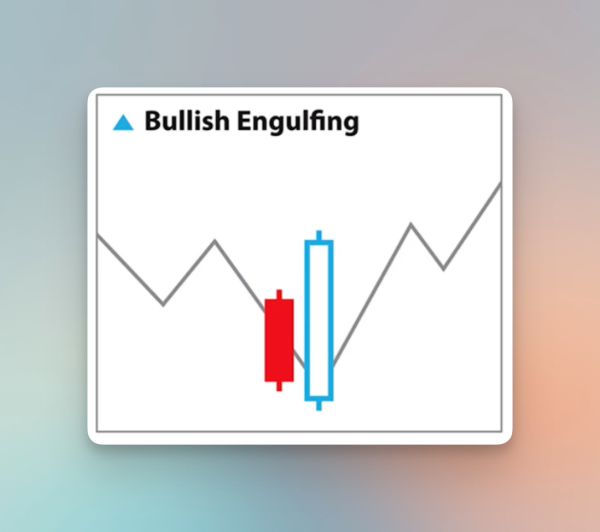
The Bullish Engulfing pattern, appearing at the end of a downtrend, indicates a potential bullish reversal. It’s formed by a small bearish candle followed by a large bullish candle that completely covers the first. This suggests a shift from selling to buying pressure.
Characteristics:
Forecast: Potential bullish reversal.
Appearance: Found at the end of a downtrend.
Opposite: Bearish Engulfing Pattern, indicating a bearish reversal
Bearish Engulfing Pattern
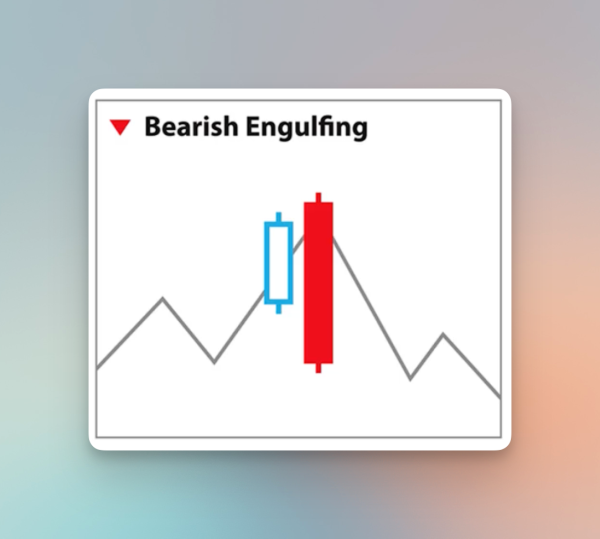
The Bearish Engulfing pattern signals a potential bearish reversal at the end of an uptrend. It consists of a small bullish candle followed by a large bearish candle that engulfs the first, indicating a shift from buying to selling pressure.
Characteristics:
Forecast: Potential bearish reversal.
Appearance: Occurs at the end of an uptrend.
Opposite: Bullish Engulfing Pattern, indicates a bullish reversal
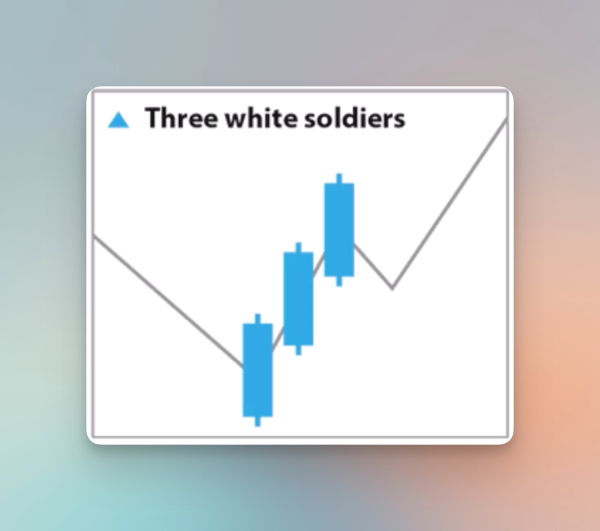
Three White Soldiers Pattern
Characteristics:
-
Formation: This pattern features three consecutive long-bodied white (or blue) candlesticks. Each candlestick opens within the body of the previous candle and closes higher, resembling soldiers standing tall in a row.
-
Trend Indication: The Three White Soldiers pattern is a bullish indicator. It suggests a strong reversal of the downward trend, signaling a shift towards an upward trend.
-
Market Context: It typically forms at the end of a downtrend or during a period of consolidation, indicating that the buying pressure is overtaking the selling pressure.
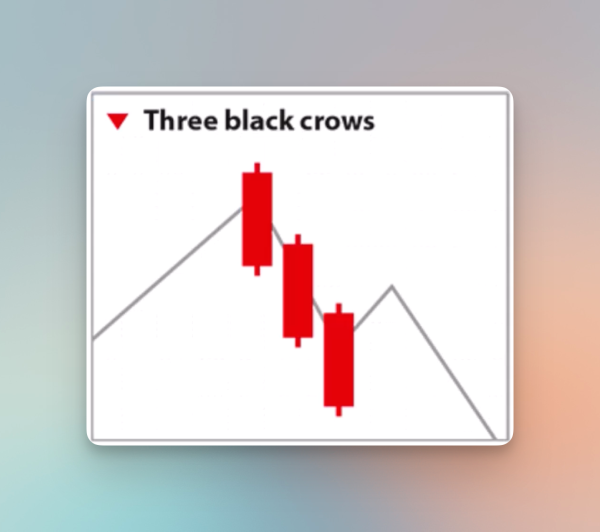
Three Black Crows Pattern
Characteristics:
-
Formation: This pattern is composed of three consecutive long-bodied black (or red) candlesticks. Each candlestick opens within the body of the previous candle and closes lower, resembling crows perched on a fence, each one lower than the last.
-
Trend Indication: The Three Black Crows pattern is a bearish indicator. It signals a strong reversal of the upward trend, indicating a shift towards a downward trend.
-
Market Context: This pattern usually appears at the end of an uptrend or a bullish price movement, suggesting that the sellers are gaining control over the buyers.
The Various Trading Styles with FxMagnetic Indicators
Before using the specific trading styles in the MetaTrader 4 environment using indicators, it’s important to understand the “regular” and “reverse” strategies.
Note: If you’re new to setting up your FxMagnetic indicator, check out our guide explaining how to set up your FxMagnetic Indicator.
Regular and Reverse Strategies
Regular Strategies: Trading signals in regular strategies are consistent with standard market interpretations. For example, a BUY signal is sent when an uptrend is expected based on market analysis.
Reverse Strategies: Trading signals in reverse strategies are opposite to traditional market interpretations. For example, a BUY signal is sent under conditions where traditional market analysis would suggest a SELL signal.
Signal Duration and Closing in Regular and Reverse Strategies
An important aspect across all FxMagnetic indicators, whether employing regular or reverse strategies, is the dynamic nature of trading signals. In both types of strategies:
A BUY signal can close earlier than anticipated if a SELL signal emerges due to specific market patterns, and vice versa for a SELL signal. This indicates that not all trades are guaranteed to reach their designated Stop Loss (SL) or Take Profit (TP) points, as they could end earlier in response to changing market conditions.
However, in “Buy Only” or “Sell Only” strategies, trades will always conclude at the TP or SL points and, if required, users can also manually close trades earlier.
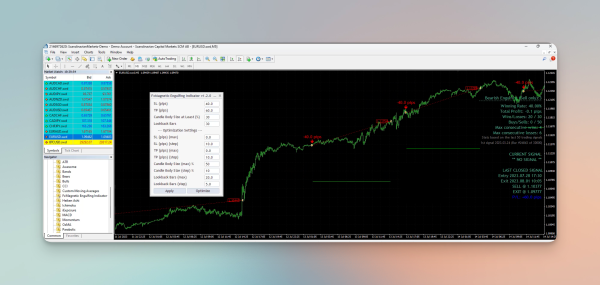
FxMagnetic Star
The FxMagnetic Star indicator is a versatile tool for traders using MT4. It is specially designed to identify and react to specific candlestick patterns, such as Morning and Evening Stars, Inverted Hammers, and Shooting Stars. This section elaborates on how to implement various trading styles using this indicator.
To begin, install and attach the FxMagnetic Star indicator to your preferred chart in MT4. Navigate to the indicator settings, and in the input section, you will find a range of trading styles to select from. Each style caters to different trading strategies and risk appetites, allowing for customization based on individual preferences.
Here’s a list of the trading styles available with the FxMagnetic Star Indicator:
-
Regular: Generates buy signals on Morning Star patterns and sell signals on Evening Star patterns.
-
Reverse: Inverts the regular signals, selling on Morning Stars and buying on Evening Stars.
-
Buy Only: Focuses exclusively on generating buy signals on Morning Star patterns.
-
Sell Only: Provides only sell signals on Evening Star patterns.
-
Reverse Sell Only: Generates sell signals on Morning Star patterns.
-
Reverse Buy Only: Produces buy signals on Evening Star patterns.
Demonstration of Trading Styles with FxMagnetic Star
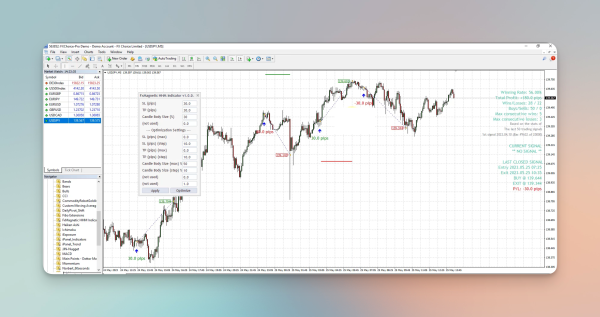
FxMagnetic Engulfing Indicator
The FxMagnetic Engulfing Indicator is another Indicator in the FxMagnetic’s suite of indicators. It is designed to identify specific engulfing patterns – bullish and bearish – which are key indicators of potential trend reversals.
Here’s a list of the trading styles available with the FxMagnetic Engulfing Indicator:
-
Regular: This style is straightforward, signaling a buy on Bullish Engulfing patterns and a sell on Bearish Engulfing patterns. It is ideal for traders who follow traditional pattern interpretations.
-
Reverse: In this style, the signals are inverted. It generates sell signals on Bullish Engulfing patterns and buy signals on Bearish Engulfing ones. This contrarian approach can capture unique market opportunities.
-
Buy Only and Sell Only: Similar to the strategies discussed earlier, these focus solely on either bullish (buy only) or bearish (sell only) engulfing patterns. These are suitable for traders with a directional bias in the market.
-
Reverse Buy Only and Reverse Sell Only: These styles adopt an inverse approach, with the Reverse Buy Only strategy focusing on buying in typically bearish scenarios (Bearish Engulfing) and the Reverse Sell Only on selling in typically bullish scenarios (Bullish Engulfing). These strategies can be advantageous in markets where traditional patterns might not play out as expected.
Demonstration of Trading Styles with FxMagnetic Engulfing Indicator
To effectively use the FxMagnetic Engulfing indicator in MetaTrader 4, traders can follow these practical demonstrations of each trading style:
-
Regular Bullish and Bearish Engulfing: This style leverages the traditional interpretation of engulfing patterns. When a bullish engulfing pattern is detected in a downtrend, a buy signal is generated, and conversely, a sell signal is issued when a bearish engulfing pattern appears in an uptrend. This approach aligns with conventional market wisdom and is suited for trend-reversal strategies.
-
Reverse Bullish and Bearish Engulfing: Offering a contrarian perspective, this style generates buy signals when bearish engulfing patterns are detected and sell signals for bullish engulfing patterns. This approach can be particularly effective in markets where reversals are frequent and abrupt.
-
Buy Only and Sell Only Engulfing Strategies: Focusing exclusively on one type of signal, these strategies are straightforward yet powerful. The ‘Buy Only’ strategy generates signals on bullish engulfing patterns, ideal for traders with a bullish market outlook. Conversely, the ‘Sell Only’ strategy focuses on bearish engulfing patterns, suited for traders anticipating a bearish market trend.
-
Reverse Buy Only and Reverse Sell Only Engulfing Strategies: These strategies take a unique approach by reversing the traditional interpretations. The Reverse Buy Only strategy generates buy signals on bearish engulfing patterns, while the Reverse Sell Only strategy does the opposite, creating sell signals on bullish engulfing patterns. These strategies are designed for traders looking to capitalize on counterintuitive market movements.
FxMagnetic HHM Indicator
The FxMagnetic HHM (Hammer and Hanging Man) Indicator is another indicator that is a part of the FxMagnetic Indicators suite in MetaTrader 4. It specializes in identifying the Hammer and Hanging Man candlestick patterns.
Here’s a list of the trading styles available with the FxMagnetic HHM Indicator:
-
Regular: This style aligns with traditional candlestick interpretation, generating buy signals on Hammer patterns (indicative of bullish reversals) and sell signals on Hanging Man patterns (suggestive of bearish reversals). It’s suitable for traders who adhere to conventional market analysis.
-
Reverse: Offering a contrarian perspective, this style generates sell signals on Hammer patterns and buy signals on Hanging Man patterns, challenging traditional market sentiments. This approach can be beneficial in markets exhibiting atypical behavior.
-
Buy Only and Sell Only: These strategies focus exclusively on one type of signal. The ‘Buy Only’ strategy generates signals based on Hammer patterns, suitable for traders with a bullish outlook. The ‘Sell Only’ strategy, on the other hand, focuses on Hanging Man patterns, tailored for traders with a bearish market perspective.
-
Reverse Buy Only and Reverse Sell Only: These strategies invert traditional interpretations. The Reverse Buy Only strategy generates buy signals from Hanging Man patterns, while the Reverse Sell Only strategy generates sell signals from Hammer patterns. These are designed for traders seeking to exploit unconventional market movements.
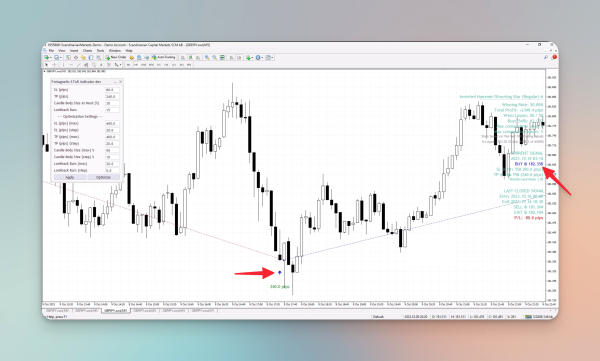
Demonstration of Trading Styles with FxMagnetic HHM Indicator
Practical applications of the FxMagnetic HHM indicator in MetaTrader 4 are as follows:
-
Regular Hammer and Hanging Man: This strategy is ideal for traders seeking to capitalize on classic trend reversal signals. For instance, when a Hammer pattern is identified at the bottom of a downtrend, the indicator will signal a buy, suggesting an upcoming bullish reversal. Conversely, a Hanging Man pattern at the top of an uptrend will trigger a sell signal, indicating a potential bearish reversal.
-
Reverse Hammer and Hanging Man: In this approach, the indicator generates opposite signals to the traditional interpretations. A sell signal is issued when a Hammer pattern is spotted, and a buy signal is given on a Hanging Man pattern. This strategy can be intriguing for traders looking to catch early reversals before they become apparent.
-
Buy Only and Sell Only: These straightforward strategies focus solely on one type of pattern. The ‘Buy Only’ strategy will signal buys on every Hammer pattern, ignoring Hanging Man patterns. Similarly, the ‘Sell Only’ strategy will signal sells on every Hanging Man pattern, disregarding Hammer patterns. These are suitable for traders with a strong directional bias in the market.
-
Reverse Buy Only and Reverse Sell Only: Adopting a non-traditional approach, these strategies generate buy signals from typically bearish patterns (Hanging Man) and sell signals from typically bullish patterns (Hammer). They offer an alternative strategy for traders willing to take on counterintuitive positions.
FxMagnetic Onyx Indicator
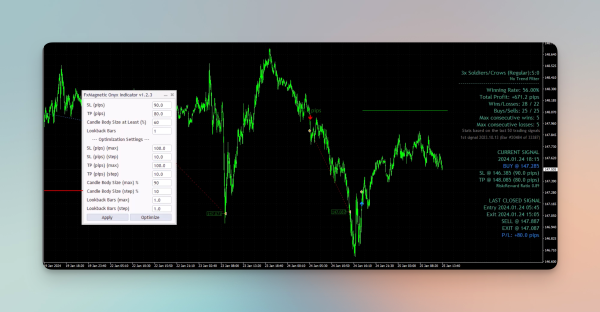
The FxMagnetic Onyx indicator, part of the MetaTrader 4 suite, helps to identify and interpret the Three White Soldiers and Three Black Crows candlestick patterns.
Three White Soldiers is a bullish candlestick pattern consisting of three consecutive long-bodied candlesticks in an upward trend, indicating a possible buy situation.
Three Black Crows is the bearish counterpart, featuring three consecutive long-bodied candlesticks in a downward trend, indicating a potential sell situation.
Here’s an overview of the trading modes available with the FxMagnetic Onyx Indicator:
Regular: This is the standard setting, where the indicator provides a buy signal when the “Three White Soldiers” pattern emerges, suggesting a bullish trend. Conversely, it issues a sell signal upon identifying the “Three Black Crows” pattern, indicating a bearish movement. This mode is tailored for traders who prefer classic pattern analysis.
Reverse: This mode flips the traditional interpretations. Here, a sell signal is triggered by the “Three White Soldiers” pattern, and a buy signal is issued for the “Three Black Crows” pattern. This unconventional approach can be useful for traders looking to capitalize on atypical market movements.
Buy Only: In this approach, the indicator focuses exclusively on the “Three White Soldiers” pattern, disregarding the “Three Black Crows” pattern entirely.
Sell Only: In this approach, the indicator concentrates solely on the “Three Black Crows” pattern, ignoring the “Three White Soldiers” pattern.
Reverse Buy Only: This unique approach targets buying opportunities in typically bearish scenarios, specifically when the “Three Black Crows” pattern is identified.
Reverse Sell Only: Conversely, this mode is geared towards selling in typically bullish scenarios, activated when the “Three White Soldiers” pattern appears.
Demonstration of Trading Styles with FxMagnetic Onyx Indicator
Regular: In a bullish scenario, when the market is trending upwards, the appearance of the “Three White Soldiers” pattern confirms the bullish momentum, prompting the Onyx indicator to issue a buy signal. This is particularly effective in markets where trends are strong and clear. Conversely, in a bearish scenario, when the market is in a downtrend, the emergence of the “Three Black Crows” pattern signals a continuation of the bearish trend, leading the indicator to generate a sell signal. This is ideal in scenarios where bearish trends are well-established.
Reverse: Upon identifying the “Three White Soldiers” pattern in an uptrend, the indicator, adopting a contrarian view, issues a sell signal. This is suitable for markets where overextension of trends is expected, anticipating a reversal. When the “Three Black Crows” pattern is spotted in a downtrend, the indicator signals a buy, suggesting a potential reversal or pullback in the bearish trend.
Buy Only: The Onyx indicator will signal a buy whenever the “Three White Soldiers” pattern is detected, regardless of market conditions. This mode is preferred by traders with a consistently bullish outlook, disregarding bearish signals.
Sell Only: This mode is tailored for traders with a bearish bias, where the indicator will generate a sell signal every time the “Three Black Crows” pattern appears, ignoring bullish signals.
Reverse Buy Only: In this mode, the indicator provides buy signals in response to the “Three Black Crows” pattern. It’s designed for scenarios where traders anticipate bullish reversals following a strong bearish signal.
Reverse Sell Only: Here, the indicator generates sell signals upon detecting the “Three White Soldiers” pattern. This mode is suited for traders expecting bearish reversals after a strong bullish trend.
Wrapping Up
In this guide, we’ve walked you through some of the core principles around candlesticks, candlestick patterns, and the different trading styles. We’ve also demonstrated how you can use the FxMagnetic Indicator suite, encompassing the Star, Engulfing, and HHM indicators, to navigate through various candlestick formations and trading styles. This guide equips you with the foundational knowledge to build on.
Next Chapter: Broker Data Paradox: The Variation in Historical Data Across Different Brokers