This is a quick guide on how to use the Parameter Optimization Matrix in FxMagnetic indicators.
Introduction
FxMagnetic is an easy-to-use set of candlestick indicators that help traders spot profitable trading opportunities on the MetaTrader 4 platform. These opportunities are spotted by identifying common patterns, and optimizing these patterns using the Parameter Optimization Matrix can significantly enhance your trading decisions.
In this guide, you will learn how to use the Parameter Optimization Matrix in the FxMagnetic Indicator. For the purpose of this guide, we’ll focus on the Parameter Optimization Matrix for Engulfing Patterns. It is important to note that the setup steps detailed below apply to each FxMagnetic indicator unless stated otherwise.
Understanding Candlestick Patterns
Before we dive into the Parameter Optimization Matrix, it is important to refresh our memory with an overview of common candlestick patterns.
In forex trading, Engulfing, STAR, and Hammer & Hanging Man are common candlestick patterns that are used by traders to assess market trends and make trades based on those trends.
1. Engulfing Patterns: This pattern consists of two candlesticks and is a signal of a potential reversal in the current trend.
-
-
Bullish Engulfing: Occurs at the end of a downtrend. The first candle is a short red (down) candle, followed by a larger green (up) candle that completely engulfs the red candle. This indicates buyers have overtaken sellers and suggests a possible upward trend.
-
Bearish Engulfing: Occurs at the end of an uptrend. The first candle is a short green candle, followed by a larger red candle that engulfs the green candle. This indicates sellers are taking control and a potential downward trend.
-
2. Star Patterns: These are reversal patterns that can be bullish or bearish, depending on their formation.
-
-
Morning Star: This is a bullish pattern occurring in a downtrend. It starts with a long red candle, which is followed by a short-bodied candle (the star), and then a long green candle. It signals the end of a downtrend.
-
Evening Star: This is the bearish counterpart that appears in an uptrend. It begins with a long green candle, followed by a short-bodied candle, and ends with a long red candle. It signals a potential downtrend.
-
3. Hammer and Hanging Man Patterns: Both of these patterns have a small body and a long lower wick, but their implications differ based on the trend context.
-
-
Hammer: This appears in a downtrend and signals a potential reversal. It has a small green body at the top with a long lower wick, which indicates that selling pressure was resisted and buyers might be gaining control.
-
Hanging Man: This appears in an uptrend and suggests a potential reversal. It looks like a hammer but occurs at the top of an uptrend, which indicates that the buyers are losing control and sellers may take over, leading to a price drop.
-
Understanding the Parameter Optimization Matrix
The Parameter Optimization Matrix is a testing of various indicator settings to determine the best ones to put you in the position to succeed, or in other words, test every possible variation of parameters to find the one with the highest win rate. Integrated within the FxMagnetic Indicator in MT4, it is designed to automate and go through the testing of various trading parameters. This matrix allows traders to fine-tune their strategies by finding the most effective settings for indicators such as Stop Loss, Take Profit, Candle Body Size, and Lookback Bars, thereby maximizing the potential for profitable trades.
Getting Started
Pre-requisites
Before diving into the optimization process, it’s important to have the FxMagnetic Indicator set up in your MetaTrader 4 (MT4) platform. If you’re not familiar with the setup process, please refer to our previous guide.
Initial Indicator Settings
Trading Strategy
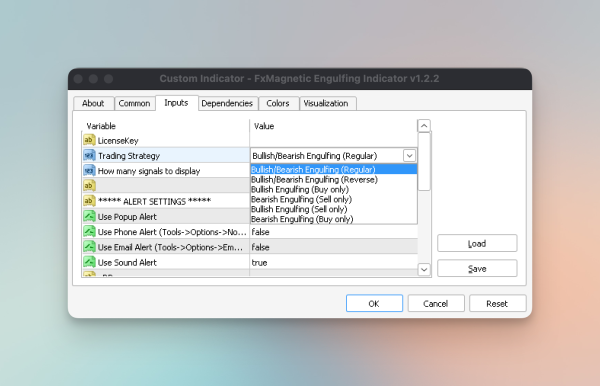
The Trading Strategy setting in an indicator allows traders to select the specific strategy that the indicator will use to identify potential trades. Choosing a trading strategy specifies the sorts of patterns the indicator will focus on and the conditions under which it will signal trades. Different strategies may be suited to different market conditions, trading styles, and risk assessments.
How Many Signals to Display
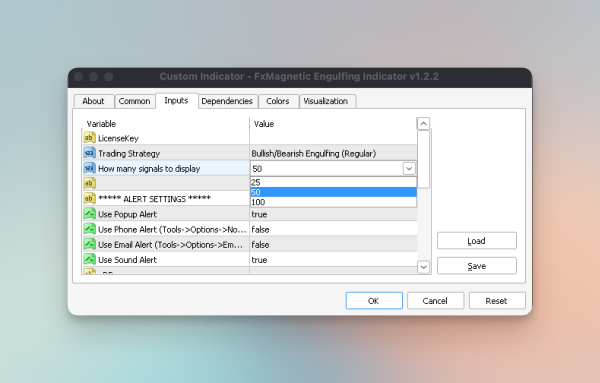
This setting controls the number of trade signals the indicator will display on the chart. Setting the appropriate number of signals to display helps in analyzing the frequency and reliability of the patterns over a given period. It can provide insights into the effectiveness of the strategy and help in backtesting. Too many signals might clutter the chart, while too few might not provide enough information for a thorough analysis. If you are not sure how many signals to choose, we recommend 50 signals.
Minimum Risk-to-Reward Ratio

This parameter sets the minimum threshold for the risk-to-reward ratio that a trade signal must meet to be regarded as viable. The risk-to-reward ratio metric assesses the potential reward of a trade relative to its risk. By setting a minimum risk-to-reward ratio, you ensure that the trading signals generated by the indicator meet a certain standard of potential profitability. For example, setting a minimum RR ratio of 2 would mean the indicator will ignore strategies with an RR ratio below 2. RR ratio of 2 means the Take Profit has to be 2 times bigger than the Stop Loss (i.e., SL 20 pips and TP 40 pips).
Maximum Risk-to-Reward Ratio
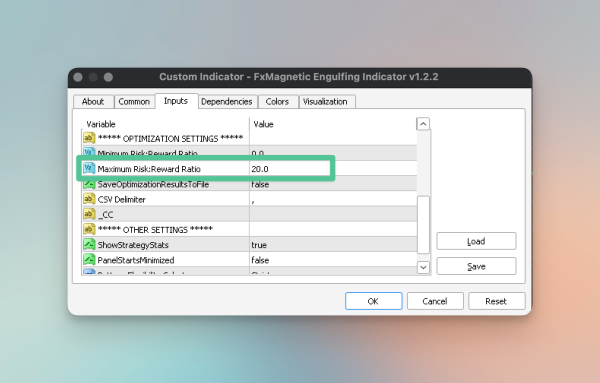
The maximum risk-to-reward ratio sets an upper limit on the risk-to-reward ratio for trade signals. It caps the risk level relative to the potential reward. This setting helps in filtering out overly risky trades. It’s a crucial aspect of risk management, making sure that the trades you consider do not cross a certain level of risk, even if they offer high potential rewards. It’s about finding a balance between risk and reward that aligns with your trading strategy and risk tolerance. A common practice among traders is to use a maximum risk-to-reward ratio ranging from 2 to 4. This is because a maximum risk-to-reward ratio of 5 and above usually produces a low win rate, and hence is recommended to only be used with 100 trading signals for better statistical significance.
Save Optimization Results to File
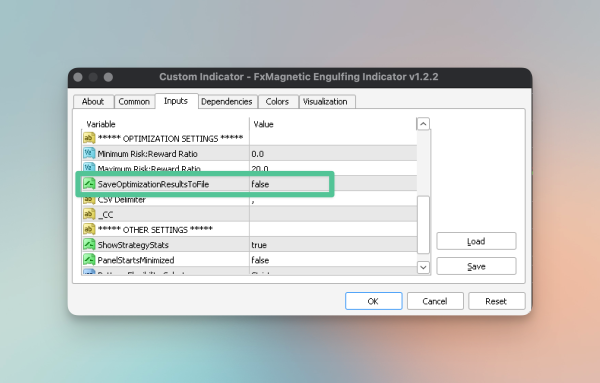
When this setting is set to true, the optimization results generated by the FxMagnetic Indicator are automatically saved to a CSV file. This file will contain detailed information about each set of parameters tested during the optimization process. It is important to note that the generated CSV file will include all variations even if they were ignored by a risk-to-reward ratio or other filters. This allows you to perform further analysis of strategies from lots of simulations.
Step-by-Step Optimization
Parameter Settings
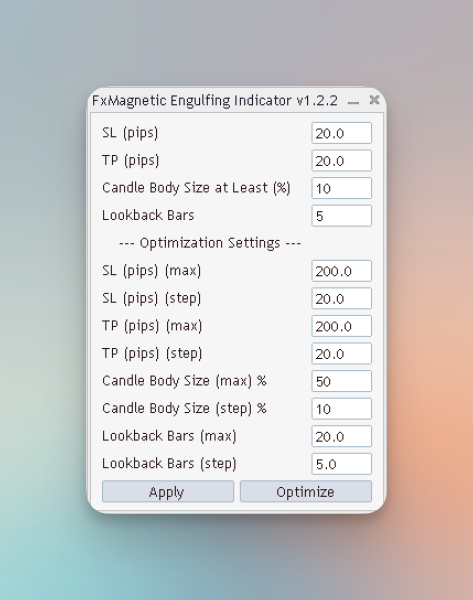
In the FxMagnetic Indicator settings, adjust the parameters for optimization. For Stop Loss and Take Profit, define the maximum values and the steps in pips. For Candle Body Size, set the maximum percentage and the incremental step percentage. For Lookback Bars, establish the maximum number and the step count. These settings determine the range of variations the matrix will test during optimization. The four parameters at the top, Stop Loss, Take Profit, Candle Body Size, and Lookback Bars, act as a starting point for your configuration for optimization. Define these primary parameters first and then define the max and step values for each of these parameters that you’re willing to reach. We have added example values in the screenshot above to demonstrate
Stop Loss (Pips) (Max): The maximum pips you’re willing to risk as a stop loss. This sets the upper limit for the optimization.
Stop Loss (Pips) (Step): The incremental step in pips for testing different stop loss levels. Smaller steps can provide more granular optimization results.
Take Profit (Pips) (Max): The maximum pips you aim to gain as a take profit. Like stop loss, this sets the ceiling for the optimization.
Take Profit (Pips) (Step): The step increment for testing various take profit levels.
Candle Body Size (Max) %: The maximum percentage of the candle body size in relation to the engulfing pattern. This determines the sensitivity of the pattern recognition.
Candle Body Size (Step) %: Incremental percentage steps for testing different candle body sizes.
Lookback Bars (Max): The maximum number of bars the indicator will look back to identify the pattern. This influences how the indicator interprets the trend and patterns.
Lookback Bars (Step): The step count for varying the number of lookback bars.
Running the Optimization
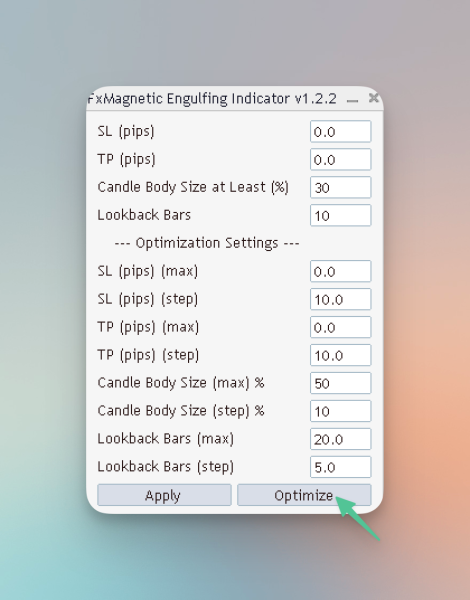
Starting the Process: In the MT4 terminal, go to the Indicator Menu, and configure the parameters detailed above with your desired values. Click Optimize to initiate the optimization process.
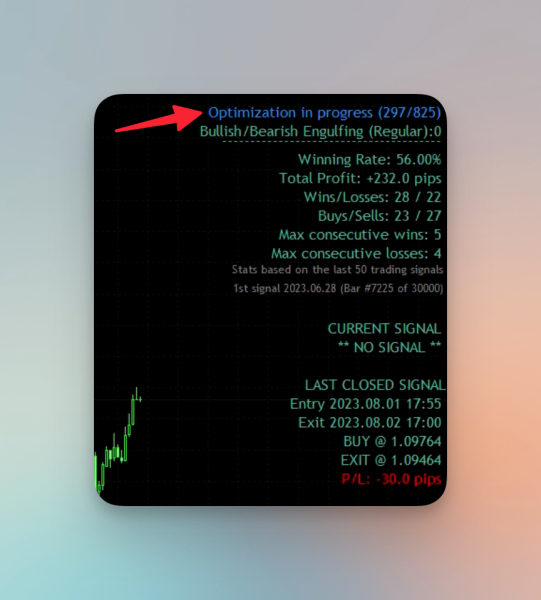
Monitoring Progress: Watch the optimization process in real-time. FxMagnetic will test various combinations of the parameters you’ve set. As the optimization is in progress, you can actively monitor the number of variations it has tested, as shown below in the screenshot. Depending on the number of simulations the indicator has to run, it can take from a few minutes to an hour or more. The pace is also dependent on your computer’s speed and the complexity of the strategy.
Exporting and Interpreting the Data
Once the optimization is completed you can access all the tested variations through a CSV File. You can export and open the CSV file in Excel or Google Sheets to then use sorting and filtering features to analyze the data more deeply and look for settings with the best risk-to-reward ratios, highest win rates, and overall profitability. This analysis can provide insights into the most effective parameter settings for your strategy.
To access the optimization results, follow these steps:
1. Click on File in the main menu of your MetaTrader platform.
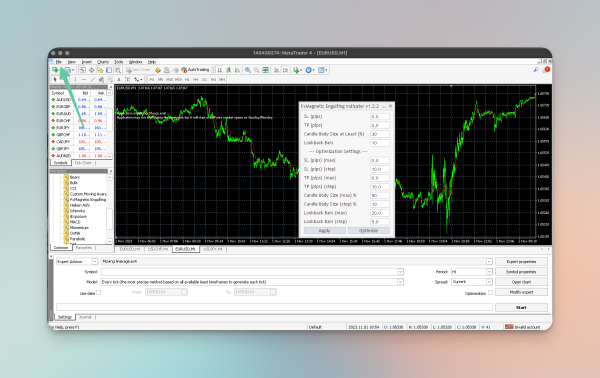
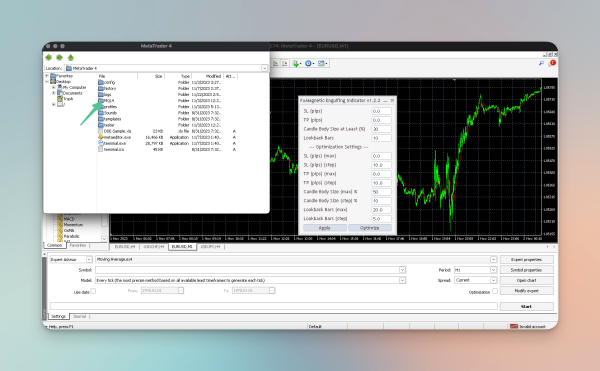
2. Select Open Data Folder to access the root directory of your MT4 installation.

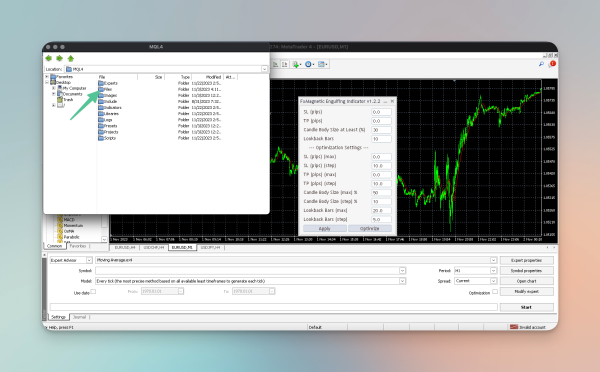
3. Navigate to the MQL4 folder.
4. Inside MQL4, open the Files folder.
5. Here, locate the FxMagnetic Engulfing Optimization Results folder
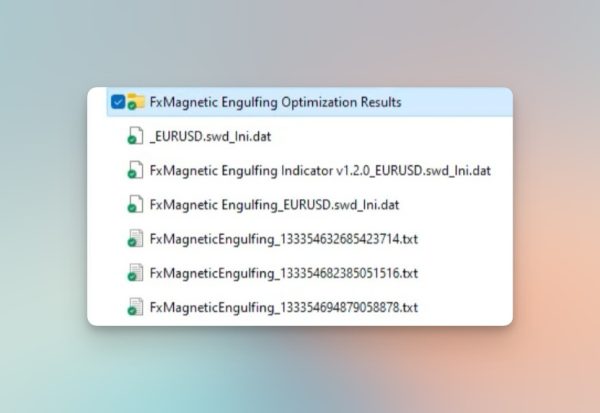
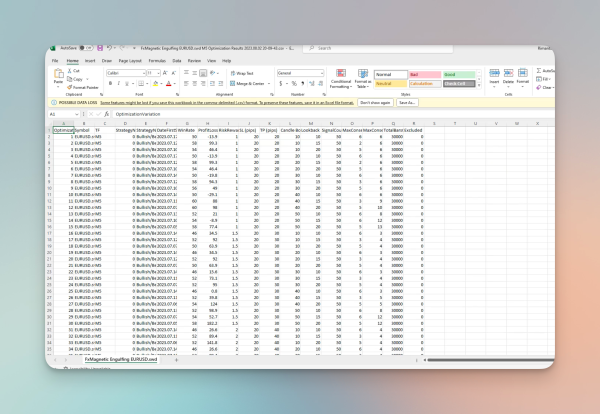
6. The final step is to Open the CSV file in this folder with Excel or Google Sheets. Below is an example of an exported FxMagnetic Engulfing Optimization Results file
Note: Optimization results differ from broker to broker
Review the results post-optimization and gather the perfect combination of settings for you. Focus on key metrics such as the Winning Rate, Total Profit, Wins/Losses, Buys/Sells, and Consecutive Wins/Losses. These indicators will help you understand which parameter combinations were most effective.
After a thorough analysis of the optimal settings that yield the highest win rate, paste your chosen combinations of Stop Loss, Take Profit, Lookback Bars, and Candle Body Size values into your FxMagnetic Indicator. These refined settings will enable you to maximize your win rate potential for future trades.
Wrapping Up
In this tutorial, we have walked you through the process of using the Parameter Optimization Matrix in the FxMagnetic Engulfing Indicator. We have discussed the importance and the functionality of the parameter optimization matrix. We have also dived into setting up initial parameters, conducting the optimization process, and analyzing the results. This tutorial sets you up with basic information to start practicing optimization which will lead to potentially more profitable trading decisions.
Next Chapter: Introduction to MetaTrader 4