In this guide, we will dive into the basic functionalities of MetaTrader 4 (MT4), a leading trading platform. Whether you’re a beginner or a seasoned trader, this guide is designed to help you navigate this powerful tool.
Understanding MetaTrader 4
MetaTrader 4 is a powerful platform in forex trading, known for its user-friendly interface, amazing charting tools, and customizable features. These capabilities make it an ideal choice for both new and experienced traders.
Breakdown of MT4’s value proposition:
-
User-Friendly Interface: MT4’s intuitive design makes it easy for beginners to understand while still offering the depth required by experienced traders.
-
Advanced Charting Tools: The platform provides a wide array of charting tools that allow for detailed market analysis that helps traders make informed decisions.
-
Customizable Features: MT4 is highly adaptable which allows traders to customize its features to fit their trading styles and preferences.
Starting with MetaTrader 4
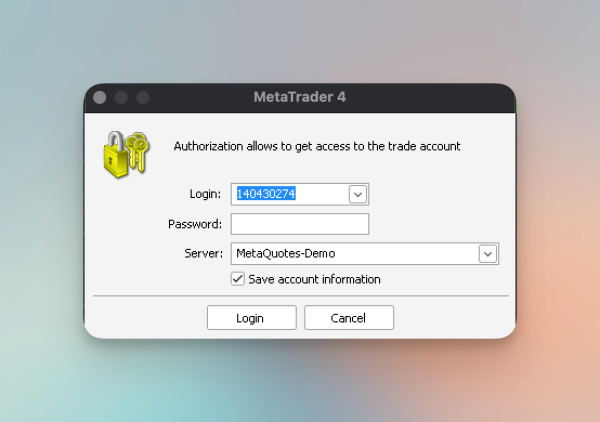
Start by downloading and installing the MT4. Upon launching the application, you’ll be prompted to enter your credentials in the login window to continue.
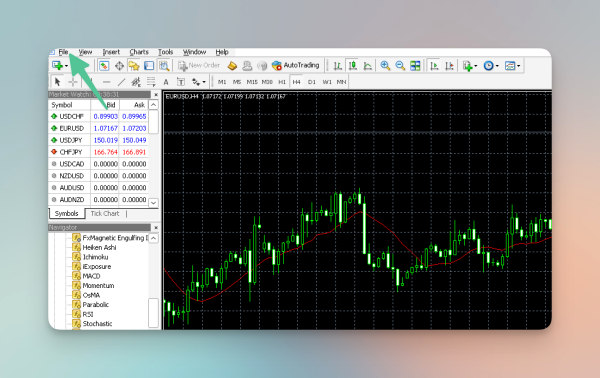
If, for some reason, the login prompt doesn’t show up, you can access it by following the steps below:
-
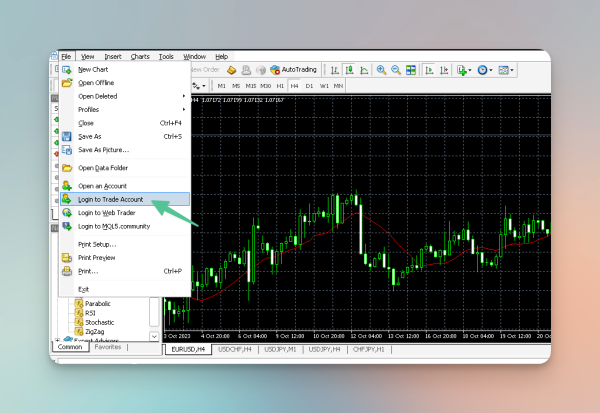
Navigating to the File menu.
-
Select Login to Trade Account.
-
Enter Credentials in the Login Window that appears.
Navigating the MetaTrader 4 Interface
Charts
Charts are fundamental to MetaTrader 4 as they offer a visual representation of market movements and trends. Their understanding and effective use are crucial for trading success.
Types of Charts
MT4 offers three types of charts:
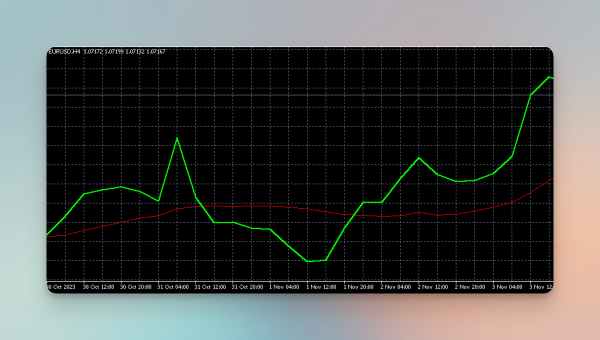
Line Chart
This is the simplest type, representing only the closing prices of each time period. It’s useful for a quick view of overall market trends.
Bar Chart
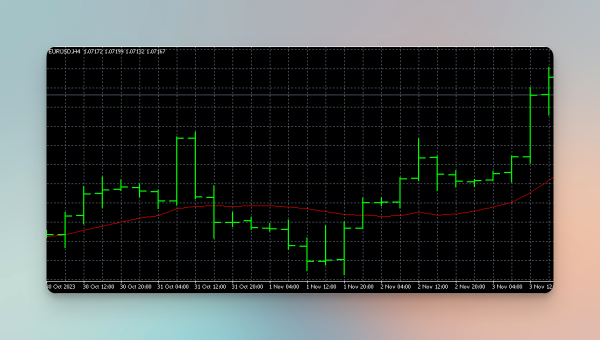
Each bar in this chart displays the opening and closing prices, as well as the highs and lows for each period. The top of the bar shows the highest price traded, and the bottom indicates the lowest price. A small horizontal line on the left side of the bar shows the opening price and a similar line on the right side represents the closing price.
Candlestick Chart
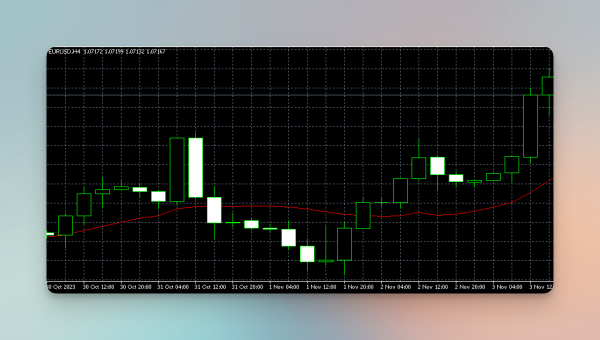
This is the type of chart that we will focus on the most. Similar to bar charts, candlestick charts also show the opening, high, low, and closing prices. They differ in their visual representation, with a wider “body” showing the range between the opening and closing prices. A candlestick is colored (often green or red) to indicate whether the closing price was higher or lower than the opening price.
Chart Elements and Customization
Time Frames
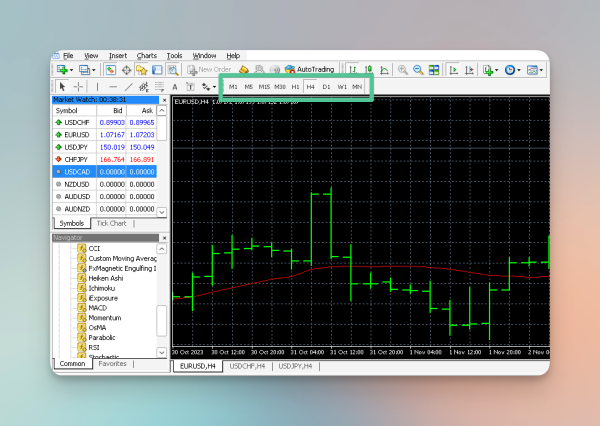
Charts can be viewed in different time frames, from one minute to one month. This allows traders to analyze short-term price movements or longer-term trends.
You can adjust the timeframe of each chart by selecting the timeframe options placed on the toolbar.
Here’s what each timeframe symbol means:
| M1 | The candlesticks are formed every 1 minute |
| M5 | The candlesticks are formed every 5 minutes |
| M15 | The candlesticks are formed every 15 minutes |
| M30 | The candlesticks are formed every 30 minutes |
| H1 | The candlesticks are formed every 1 hour |
| H4 | The candlesticks are formed every 4 hours |
| D1 | The candlesticks are formed every 1 day |
| W1 | The candlesticks are formed every 1 week |
| MN | The candlesticks are formed every 1 month |
Currency Pairs
Currency pairs are a key concept in Forex trading, as they represent the structure of the currencies being traded. In Forex trading, you are essentially buying one currency (base) and selling another (quote).
This is an example of a pair of currencies: EUR/USD. In this example, the EUR is the base currency, and USD is the quote currency.
Price and Time Axis
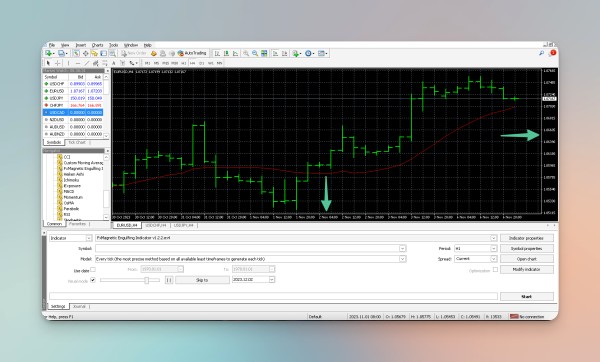
The vertical axis on the right side of the chart represents price levels. The scale adjusts based on the price movement visible in the current chart view while the horizontal axis at the bottom of the chart represents time.
Indicators
MT4 allows traders to add various technical indicators to charts. These indicators help in analyzing market trends and making trading decisions. We discuss indicators in detail in the FxMagnetic Setup Guide.
Chart Template
MT4 lets you save your chart settings, indicators, and tools as templates, so you can quickly apply them to other charts.
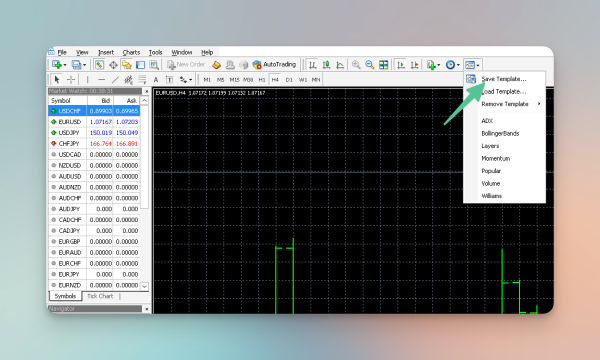
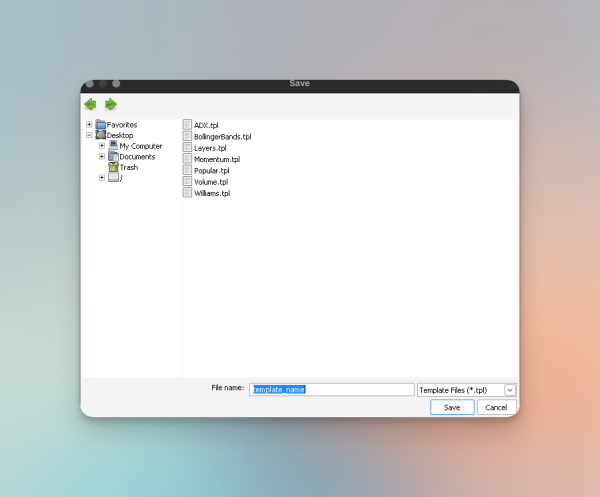
Once you have applied the settings you want to the chart, you can save them as a template through the following steps:
-
Go to Templates in the toolbar.
-
Click on Save Templates.
-
Name your template and click on Save.
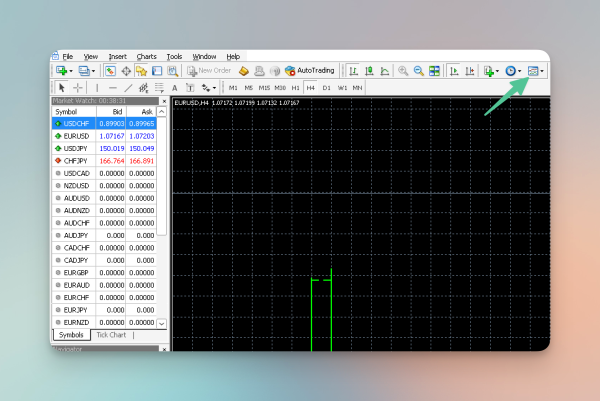
The Market Watch Window
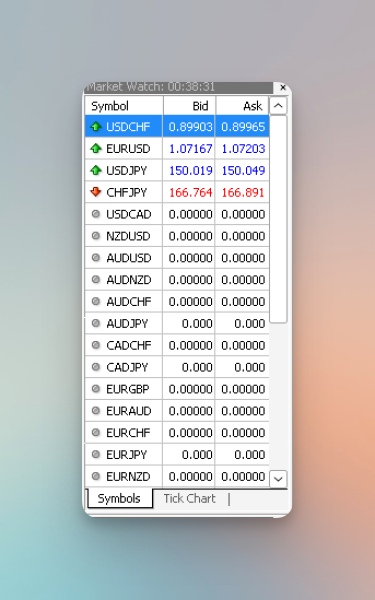
The Market Watch window, located on the left side of the MT4 interface, lists all the available trading currency pairs, or in other words, instruments/symbols offered by your broker. Each listed instrument shows real-time bid and ask prices to provide a quick overview of current market conditions.
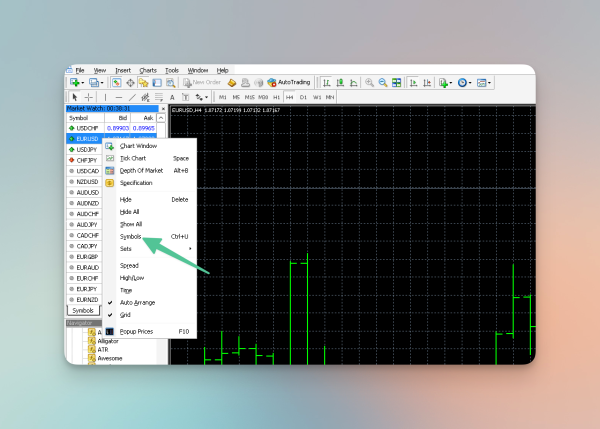
Hide/Show Symbols
You can customize the list to display only those instruments you are interested in. To do this, follow the steps below:
-
Right-click within the Market Watch window and then, from the window that appears, click on Symbols.
-
A list of symbols/instruments will appear. Choose the instrument that you want displayed on Market Watch and click on Show.
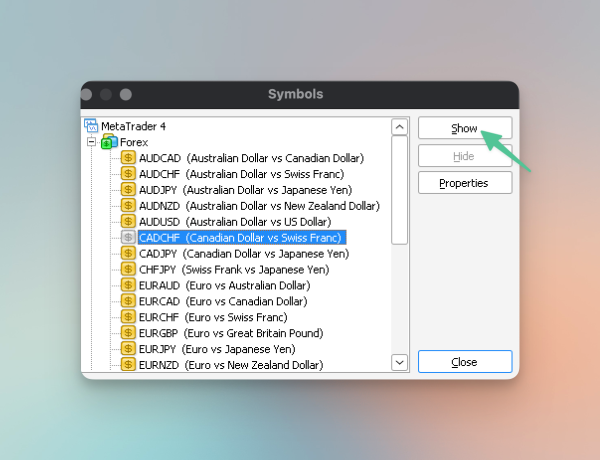
Note: Symbols in yellow are the ones that are currently being displayed on Market Watch, while the ones in grey are hidden.
Viewing Symbol Specifications
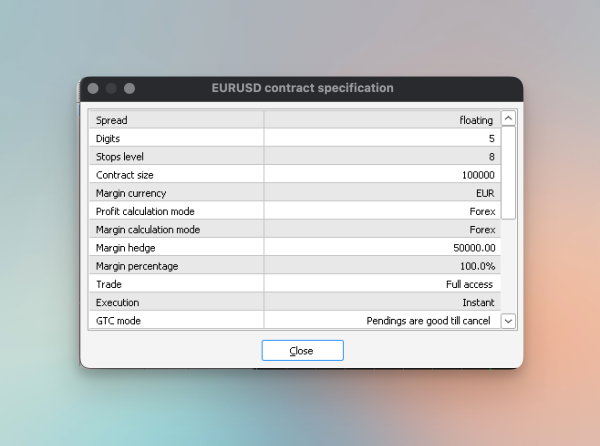
Each instrument in the Market Watch window comes with specifications. To view these, right-click on a desired symbol and select ‘Specification.’
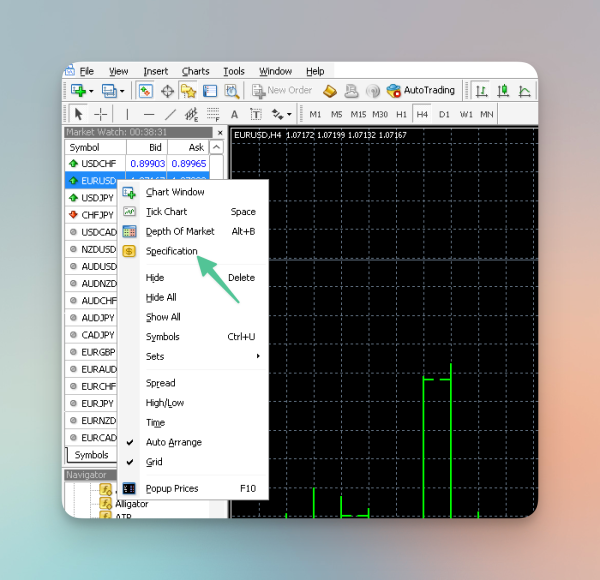
This will display details like spread, swap type, margin currency, and other relevant information. It will also provide information on the contract size, which is an important specification to reference when making a trade. We will discuss this in detail in the later sections of this guide.
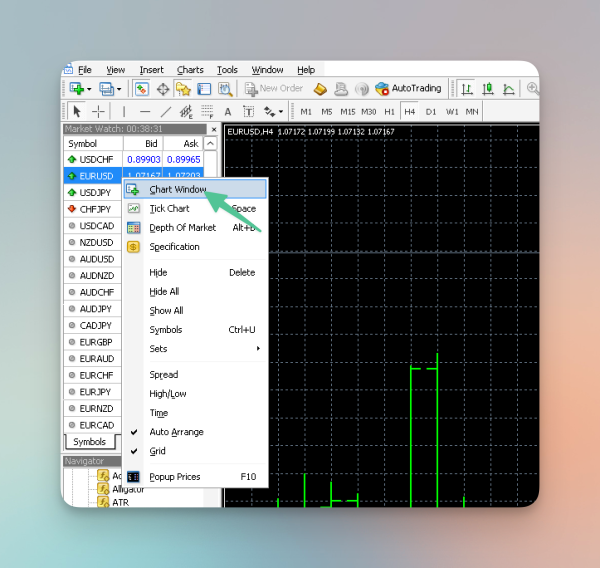
Open Charts from Market Watch
To analyze a specific instrument in more detail, you can directly open a chart from the Market Watch window. Right-click on the symbol and choose Chart Window to open a new chart tab displaying the selected instrument.
Placing Orders Directly
The Market Watch window also facilitates quick trade execution. Right-click on the desired currency pair or instrument and select New Order to open the trade window. This function is particularly useful for traders who rely on market orders or wish to enter the market quickly without navigating away from their current screen.
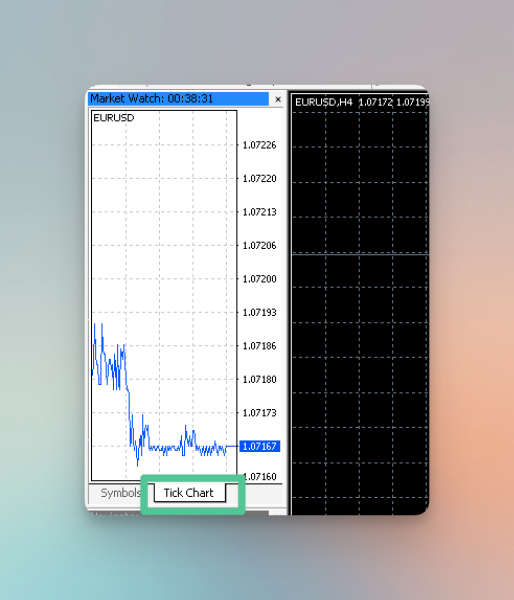
Tick Chart
The Market Watch window includes a mini tick chart for each instrument, offering a quick glimpse of recent price movements. To view the tick chart, select a symbol and then click on the ‘Tick Chart’ tab at the bottom of the Market Watch window.
Terminal
The terminal is located at the bottom of the MetaTrader 4’s interface. It is an important area for reviewing your trading activities. It has many sections, but the two that you’re going to use the most are the Trade and the Account History section. Understanding these sections will help you monitor your current trades and review past trading performance.
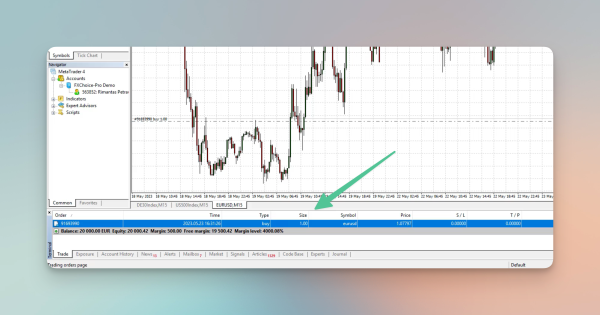
Trade Section
The Trade section in MT4 displays all your current or open trades. This is where you can see live updates of your active trading positions. In this section, you can see important information such as Trade Type, Size, Price, Profit, Stop Loss Levels, and Take Profit Levels.
Another useful feature of this section is to allow you to modify or close trades directly from here. You can modify stop loss and take profit levels directly from this section by right-clicking on the trade and selecting Modify or Delete Order. To close an open trade, right-click on the trade and choose Close Order. This is useful if you want to manually exit a trade before it hits your stop loss or take profit levels.
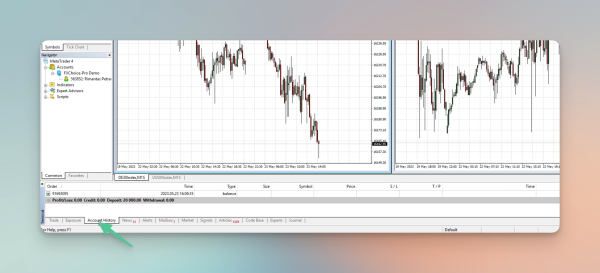
Account History
The Account History tab is a record of all your closed trades. This section allows you to analyze your trading performance over time. For each closed trade, you can see the currency pair, trade size, entry, and exit prices, the dates of opening and closing the trade, and the final profit or loss.
Trade Management in MetaTrader 4
Trade management is MetaTrader 4’s forte. MetaTrader 4 provides users with the ability to not only initiate trades but also strategically implement risk management tools like stop loss and take profit.
Starting a Trade
The first step in starting a trade is selecting the chart of the currency pair you wish to trade. This can be done in three ways:
-
From the Market Watch window.
-
By right-clicking on an already open chart.
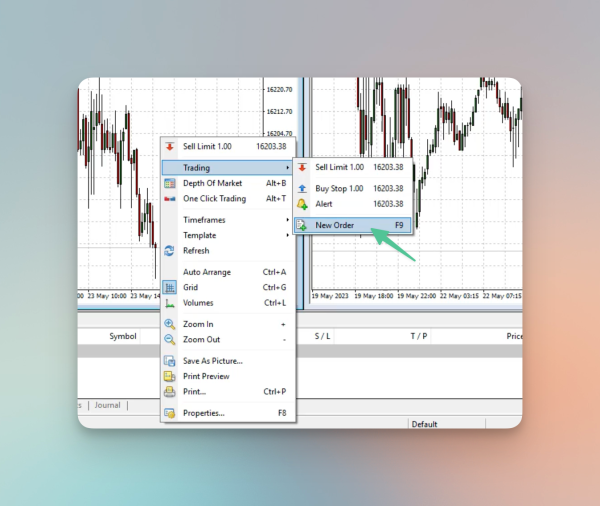
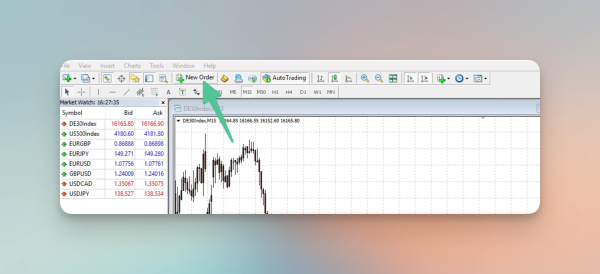
-
By clicking on New Order in the toolbar.
Initiating the Order
Once the Order window is up, you can now use this window as your control center for initiating trades.
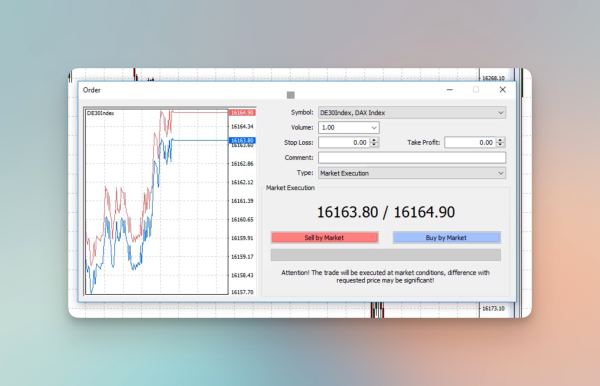
Choosing the Order Type
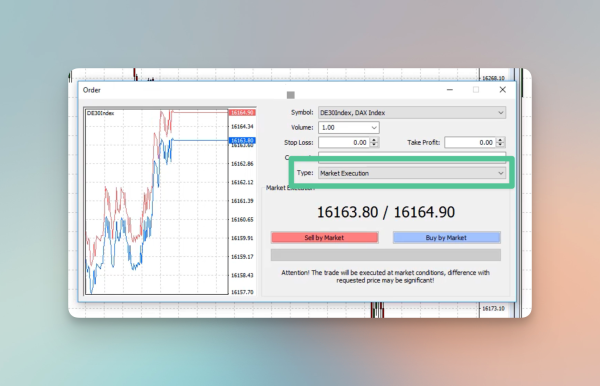
Market Order: If you select a market order, your trade will be executed at the current market price. This is suitable for traders who want to enter the market immediately.
Pending Order: A pending order allows you to specify the future price at which you wish to enter the market. This is ideal for traders who have a target entry point that has not yet been reached.
Setting Trade Volume
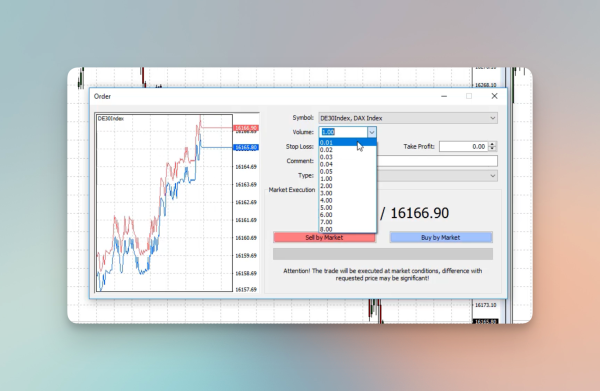
When trading in the Forex market, the amount you trade is measured in ‘lots’. A helpful way to think about a lot is as a bundle of currency units. How big this bundle is depends on the contract size of the currency you’re trading. You can choose how many lots you want to trade, which determines the amount of currency you buy or sell. For example, let’s say the contract size of a currency is 5 units. If you buy 2 lots of this currency, you’re actually buying 10 units (because 2 lots x 5 units = 10 units).
There are also smaller lot sizes, such as:
-
Micro Lot: This is a smaller lot size, equal to 0.1 of a standard lot.
-
Nano Lot: Even smaller, a nano lot is 0.01 of a standard lot. However, be aware that not all brokers offer the option to trade nano lots.
Implementing Stop Loss
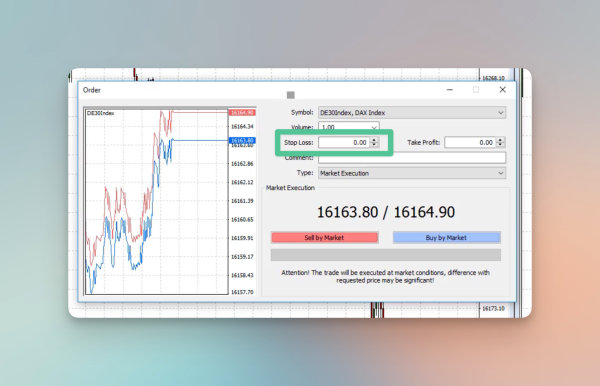
Stop Loss helps you in risk management. With Stop-Loss, you have the ability to automatically close a trade at a predetermined level. This is important to prevent significant losses in unpredictable markets. When placing a trade, you can set the stop loss level. This level should be set based on your trading strategy, objectives, and market analysis.
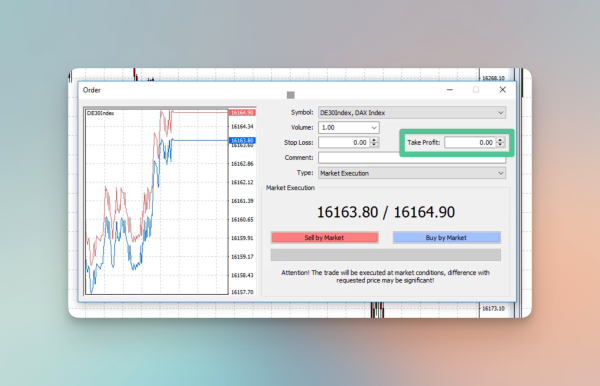
Implementing Take Profit
Take Profit orders are used to lock in profits by automatically closing the trade when it reaches a certain level of profit. Similar to stop loss, you set a take profit level when you open a trade. This level should be set based on your trading strategy, objectives, and market analysis.
Wrapping Up
MetaTrader 4 is a powerful tool with so many great features that people often get overwhelmed when starting out. This guide provides a helpful start that many people want. In this guide, we have walked you through the basics of MetaTrader 4, from understanding its interface and chart types to managing trades and customizing features. With these insights, you’re now ready to navigate the MT4 and build on your knowledge as you go.
Next Chapter: Candlesticks, Candlestick Patterns, and the Different Trading Styles