In this guide, we will introduce you to the concept of the Broker Data Paradox and how it affects your trading decisions. If you’re using two different platforms for trading, then you might already be familiar with this concept, and if not let’s fill you in with what it is and why it is important to learn about it.
Pre-requisites
Before we explore the Broker Data Paradox, it’s crucial to know how MetaTrader works, learn about using the FxMagnetic Indicator, and understand the different ways to trade with it. Check out our previous guides to help you gain a better understanding.
Introduction
When making informed trading decisions, historical data plays a crucial role. However, did you know that the data provided by different brokers can vary significantly? This phenomenon is known as the Broker Data Paradox. In this tutorial, we’ll delve into the reasons behind this paradox, its impact on trading, and potential solutions to help you make better-informed decisions.
Broker Data Paradox
The Broker Data Paradox refers to the disparity in historical market data provided by different brokers. Even though they may use the same parameters or settings, the data can differ significantly. This variation can lead to conflicting signals and trading decisions, causing frustration for traders who rely on historical data to inform their strategies.
Let’s consider an analogy to understand this concept better. Imagine visiting two different ice cream shops in two separate towns. Both shops claim to sell “chocolate” ice cream, but upon tasting them, you realize that one is darker and richer while the other is creamier. Similarly, brokers may have their unique “flavor” of historical data, leading to differences in the information they provide.
Reason for Broker Data Paradox
So, why do these differences occur? The primary reason is the way brokers collect and process data. Each broker has its proprietary data feed, which sources data from various providers. These providers may have different criteria for selecting data, leading to variations in the quality and quantity of data. Furthermore, brokers may use different algorithms to process the data, contributing to the disparities.
Another factor contributing to the Broker Data Paradox is the trader’s behavior. Traders have different buying and selling habits, which can influence the patterns identified by technical analysis tools. For instance, a bullish engulfing pattern may appear on one broker’s chart, but not on another due to differences in buyer and seller activity.
Demonstration of Broker Data Paradox
Observe the difference in the number of price bars displayed on the charts of two broker accounts, Hugo’s Way and Scandinavia Market. Despite employing the same FxMagnetic indicator and settings, a stark contrast emerges. Scandinavia Market boasts 30,000 price bars, while Hugo’s Way displays merely 12,760. This considerable variance raises questions about the nature of the data provided by each broker, underscoring the existence of the Broker Data Paradox.
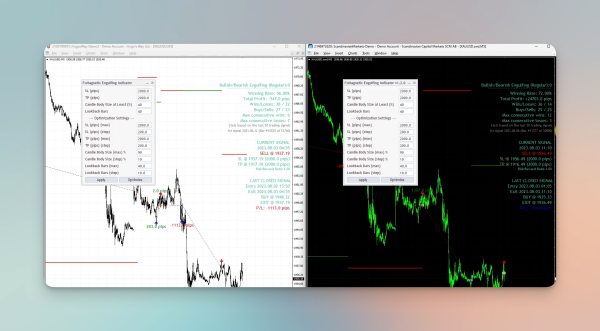
Moreover, see the difference in performance metrics between the two accounts. The win rate of Hugo’s Way stands at 56%, while that of Scandinavia Market reaches 72%. Additionally, the profit and loss ratio varies significantly, with Hugo’s Way recording 547 pips and Scandinavian Market indicating 24,000 pips in profit. These differences demonstrate that each broker provides unique data, yielding distinct trading outcomes despite using the same strategy, signal count, and flexibility indicator.
The Broker Data Paradox becomes apparent when locating a specific buy or sell signal in one broker’s data fails to appear in the other. This highlights the variability in the information displayed by each broker, necessitating careful consideration when analyzing and interpreting market data.
FxMagnetic and Broker Data Paradox
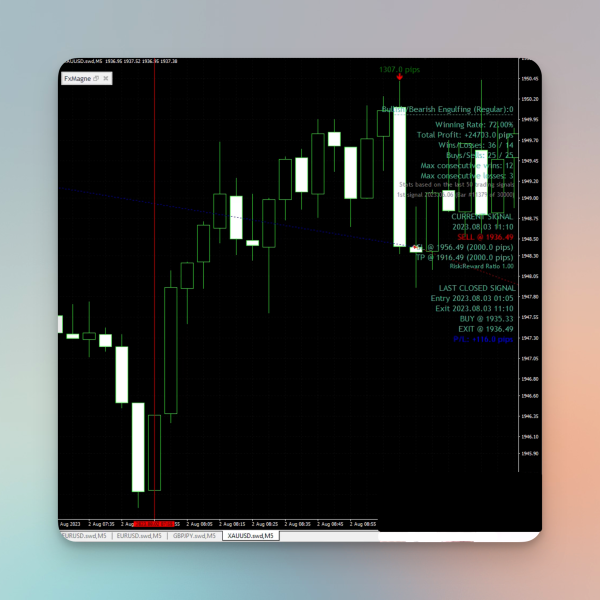
FxMagnetic indicator identifies candlestick patterns to predict market movements. It identifies signals like buy/sell opportunities based on bullish/bearish patterns, aiding traders in decision-making. As candlestick patterns may vary among broker accounts, FxMagnetic will generate distinct buy and sell signals based on the detected patterns observed across these accounts. The following demonstration will explain the role of FxMagnetic alongside broker data paradox:
FxMagnetic Indicator Settings alongside Broker Data Paradox
To demonstrate FxMagnetic indicator results alongside broker data paradox, the following settings were observed:
Stop loss: 2000
Take Profit: 2000
Candle Body Size: 40
Lookback Bars: 40
Trading Strategy: Bullish and Bearish Regular.
Pattern Flexibility: Strict
NOTE: The same settings were applied in both broker accounts. Please refer to our previous guides if you need to learn how the indicator functions or how these settings are applied.
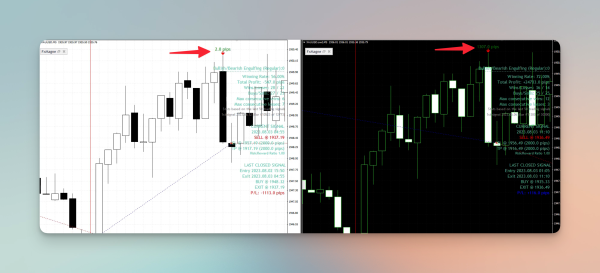
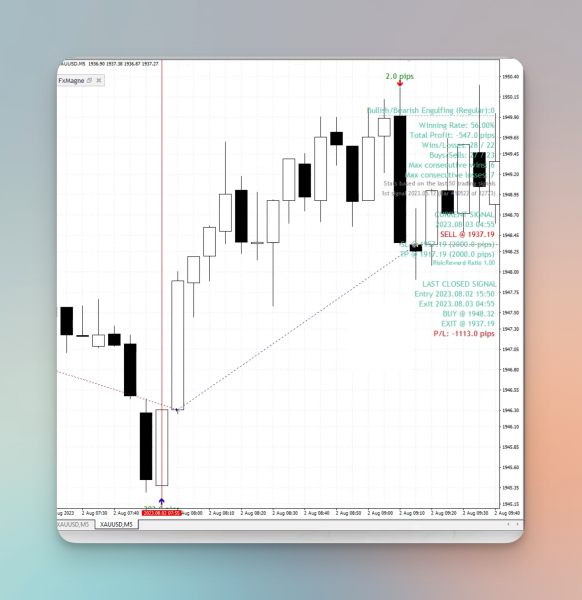
Zooming in on the price action on Hugo’s Way chart shows a bullish engulfing pattern at 8 o’clock on August 2nd, indicating a buy signal. This is followed by a bullish bar that completely engulfs the preceding bearish bar, initiating the signal.
However, at the same timeframe on the Scandinavian Market, we see that the bullish bar fails to open beneath or engulf the prior bearish bar, thus, no bullish engulfing pattern is observed.
This difference can be attributed to traders’ different buying and selling behavior on both platforms. Traders on Hugo Way demonstrate more assertive buying patterns, leading to the formation of the pattern, whereas traders on the Scandinavian Market display less aggressive buying behavior during the candle formation period.
Furthermore, even when using the same settings, differences in historical data across brokers result in diverse bars and subsequent signals, yielding different outcomes. Sometimes, a trade might make a little bit of money on some brokers, but on others, like the Scandinavian Market, it could make a lot more money simultaneously.
Pattern Flexibility Setting
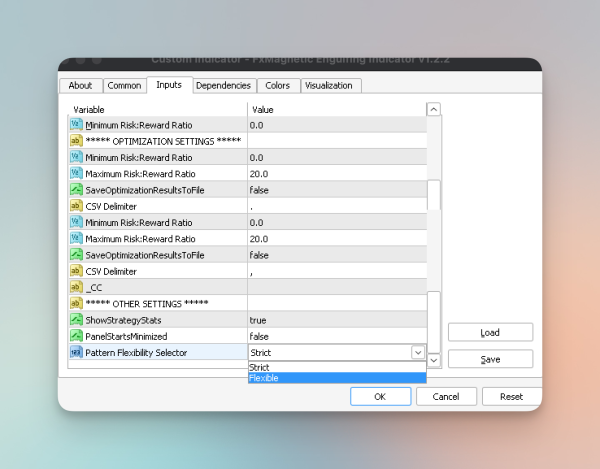
The Flexibility Selector in the FXMagnetic indicator allows traders to adjust the sensitivity of the pattern detection. By modifying this setting, traders can control the strength of the identified patterns, enabling them to fine-tune the indicator’s responsiveness to specific candlestick formations.
Changing the flexibility selector from strict to flexible adjusts the FXMagnetic indicator’s pattern recognition sensitivity. For example, if a bullish engulfing pattern is detected in a certain place in Broker A but not in Broker B due to a strict strategy, switching to a flexible strategy may enable Broker B to identify the same pattern.
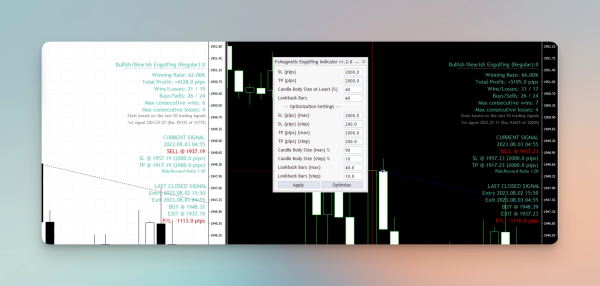
Changing the strategy to flexible, realign all signals to reflect this strategy, bringing the results closer together for both brokers. It is important to note that even with the strategy set to be flexible, there will still be variations in results between the brokers.
An example of the results after setting the pattern flexibility to flexible is shown below:
Why Broker Data Paradox Might be a Blessing in Disguise
The broker data paradox is when different traders look at the same market data and come to different conclusions about what it means. This can create opportunities for some traders to make money because they can buy or sell assets at prices that are not accurate. For example, if a trader thinks a stock is worth more than it’s currently selling for, they can buy it cheaply and then sell it at a higher price when other traders realize it’s worth more. This can be especially helpful for human traders who can analyze data in a way that computers can’t. They can find patterns or trends that computers miss, giving them an advantage over algorithmic trading systems.
Overall, the broker data paradox shows that having access to the same data doesn’t necessarily mean that all traders will have the same opinion about the market. Instead, it highlights the importance of interpreting data in a unique way and being able to spot opportunities that others might miss.
Given the diversity of preferences among traders, sharing your indicator settings and discoveries within your trading community is essential. By exchanging settings and results with relevant groups, you might uncover improved settings for your trades.
How to Align Your Trades across Many Broker Accounts
If you want to copy or align your trades from various brokers you can do so by using the Local Trade Copier, which is compatible with MetaTrader 4 and MetaTrader 5. Unlike FxMagnetic, which only works with MetaTrader 4, Local Trade Copier allows you to copy trades from one account to another.
We will discuss how to align your trades across many broker accounts in detail in another tutorial, but here’s a quick overview of how it works:
In essence, you set up two parts – a server part that connects to your main account with FxMagnetic and a client part that attaches to other accounts. When you configure them on the same computer, the Local Trade Copier Copier lets your main account (with Fxmagnetic) send trades to the other connected accounts. These accounts only need the client part running to get the same trades as your main account, no matter what broker they use or what data they have. So, if your main account gets a buy signal, all the other accounts will automatically make the same trade, letting you trade in sync across multiple accounts.
Wrapping Up
Understanding the Broker Data Paradox sheds light on the differences in historical data across different brokers. We’ve seen how the same settings on different broker accounts may generate different results, influencing the signals provided by the FxMagnetic Indicator. This paradox emphasizes the importance of understanding the nuances of broker data and how it affects trading decisions. By recognizing the differences between broker accounts, traders can adapt their strategies, use flexible settings, and explore tools like Local Trade Copier to navigate these differences and make informed trading decisions.
Next Chapter: Mastering MetaTrader Alert Systems for Efficient Trading