
To set up a strategy from a CSV file, open the CSV and pick one row. In the Scanner’s Inputs tab, set the columns marked (P1) to (P9): strategy, Strict/Flexible, stop-loss type, trade filters, trading hours and spread. Then type the four values after them (the stop-loss and take-profit multipliers and the two strategy parameters) into the Scanner panel and press Apply. The column names in the CSV match the names of the Scanner settings, so every value has exactly one place to go.
This tutorial is for FxMagnetic 3.0.2 on MT4 and MT5 and works the same in every app: FxMagnetic One, Technical Labs, Candlestick Labs, Alpha and the single Trader apps. The example uses a real CSV made by Optimize in FxMagnetic One.
Where the CSV file comes from
Every time you press Optimize, the Scanner tests many combinations of settings and saves every result to a CSV file (one row per combination). When Optimize finishes, the panel already shows the best settings it found, and a button Open CSV appears on the chart. The CSV lets you choose another row, for example one with more signals or a smaller drawdown.
- Open CSV opens the file of your last Optimize run in your spreadsheet app.
- All files are in the MetaTrader data folder: File > Open Data Folder, then MQL4 > Files (MT4) or MQL5 > Files (MT5), in a folder named after your app that ends in Optimization Results, with one sub-folder per day.
- The file name tells you the strategy number, Strict (S) or Flexible (F), the number of signals, the symbol and the timeframe, for example FxMagnetic One Scanner 1400-S-50 BTCUSD M5 2026.11.14 12-35-19.csv.
If you received strategy settings as a CSV file or a spreadsheet with the same column names, the steps below are exactly the same.
What is in a row
Here are three rows from a real Optimize file (FxMagnetic One 3.0.2, BTCUSD M5, IC Markets demo, 14 November 2026). The file has 59 columns; the picture shows the ones you need, in two parts. Yellow columns are the settings; green columns are the results of those settings.
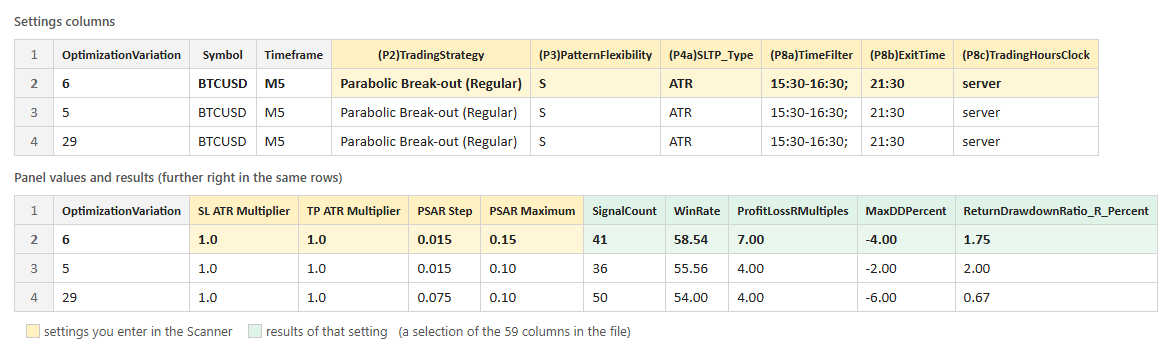
Click the picture to see it full size. This example is only to show the columns; it is not a recommendation to trade it.
We will use row 2: Parabolic Break-out (Regular), Strict, ATR stops, trading 15:30–16:30 server time with an exit at 21:30, SL ATR Multiplier 1.0, TP ATR Multiplier 1.0, PSAR Step 0.015 and PSAR Maximum 0.15. Its results: 41 signals, 58.54% win rate, +7.00R, maximum drawdown 4R.
Where each column goes
| CSV column | Example (row 2) | Where you set it |
|---|---|---|
| Symbol, Timeframe | BTCUSD, M5 | Open a chart of that symbol and timeframe (your broker’s symbol name may have a suffix). |
| (P1)HowManySignalsToDisplay | 50 | Inputs: (P1) How many signals to display |
| (P2)TradingStrategy | Parabolic Break-out (Regular) | Inputs: (P2) Trading Strategy (choose the same name in the list) |
| (P3)PatternFlexibility | S | Inputs: (P3) Pattern Flexibility Selector: S = Strict, F = Flexible |
| (P4a)SLTP_Type, (P4b)SLTP_Param1 | ATR, -1 | Inputs: (P4a) SL/TP Type and (P4b) SL/TP Parameter (-1 = default) |
| (P5)MaxTradesPerDay | 0 | Inputs: (P5) Max Trades Per Day (0 = unlimited) |
| (P6a)–(P6e) | No Trend Filter | Inputs: (P6a) Trade Filter #1, its timeframe (P6b) and parameters (P6c)–(P6e). Empty cells mean “not used”. |
| (P7a)–(P7e) | No Trend Filter | Inputs: (P7a) Trade Filter #2 and (P7b)–(P7e), the same way |
| (P8a)TimeFilter | 15:30-16:30; | Inputs: (P8a) Custom Trading Hours. Type 15:30-16:30 (the semicolon only separates several windows). |
| (P8b)ExitTime | 21:30 | Inputs: (P8b) Daily Exit Time |
| (P8c)TradingHoursClock | server | Inputs: (P8c) Clock for Trading Hours and Exit Time: “server” = Broker server time; otherwise the city shown (New York, London …) |
| (P9)SpreadArtificialPoints | 0 | Inputs: (P9) Artificial Spread (points) |
| SL ATR Multiplier, TP ATR Multiplier | 1.0, 1.0 | Scanner panel, first two fields |
| PSAR Step, PSAR Maximum | 0.015, 0.15 | Scanner panel, next two fields. Their names change with the strategy (e.g. RSI Period / RSI Level), and the CSV uses the same names as the panel. |
| SignalCount, WinRate, ProfitLossRMultiples, MaxDDPercent … | 41, 58.54, 7.00, -4.00 | Results. Nothing to enter; use them to check your setup in Step 4. |
Step 1: Open the chart
Open a chart with the same symbol and timeframe as the row (here BTCUSD, M5) and add your FxMagnetic Scanner to it if it isn’t there yet. If MetaTrader doesn’t have enough price history, the Scanner downloads it first and shows “Loading price history”.
Step 2: Set the (P) columns in the Inputs tab
- Press Ctrl+I (Indicators List), select the FxMagnetic Scanner and click Edit. The Scanner’s properties open.
- On the Inputs tab, set (P1) to (P9) to the values of your row, as in the table above.
- Click OK. The Scanner recalculates with the new strategy.
Leave the other inputs (licence key, alerts, colours, optimization settings) as they are.
Step 3: Type the four panel values and apply
The panel on the chart now shows the fields of the chosen strategy. Type the values from the row into the first four fields:
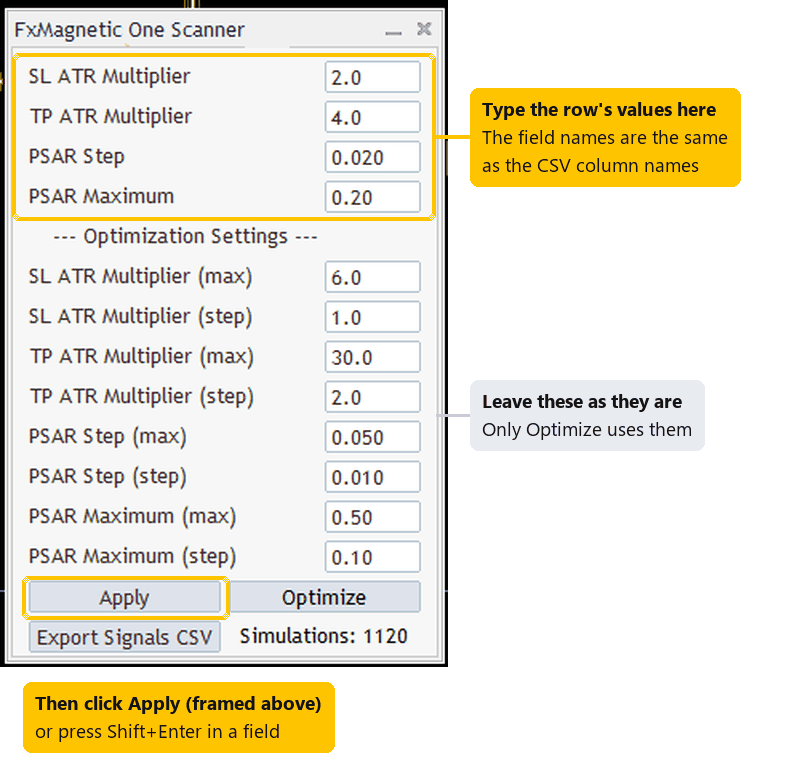
A real FxMagnetic One 3.0.2 panel with a Parabolic strategy (USTEC H2, MT5). For row 2 of the example you would type 1.0, 1.0, 0.015 and 0.15 into the four framed fields.
- Click the first field, or press Tab to get there. Tab moves to the next field, Shift+Tab moves back.
- Type each value. Use a dot as the decimal separator (0.015).
- Press Shift+Enter in a field, or click Apply.
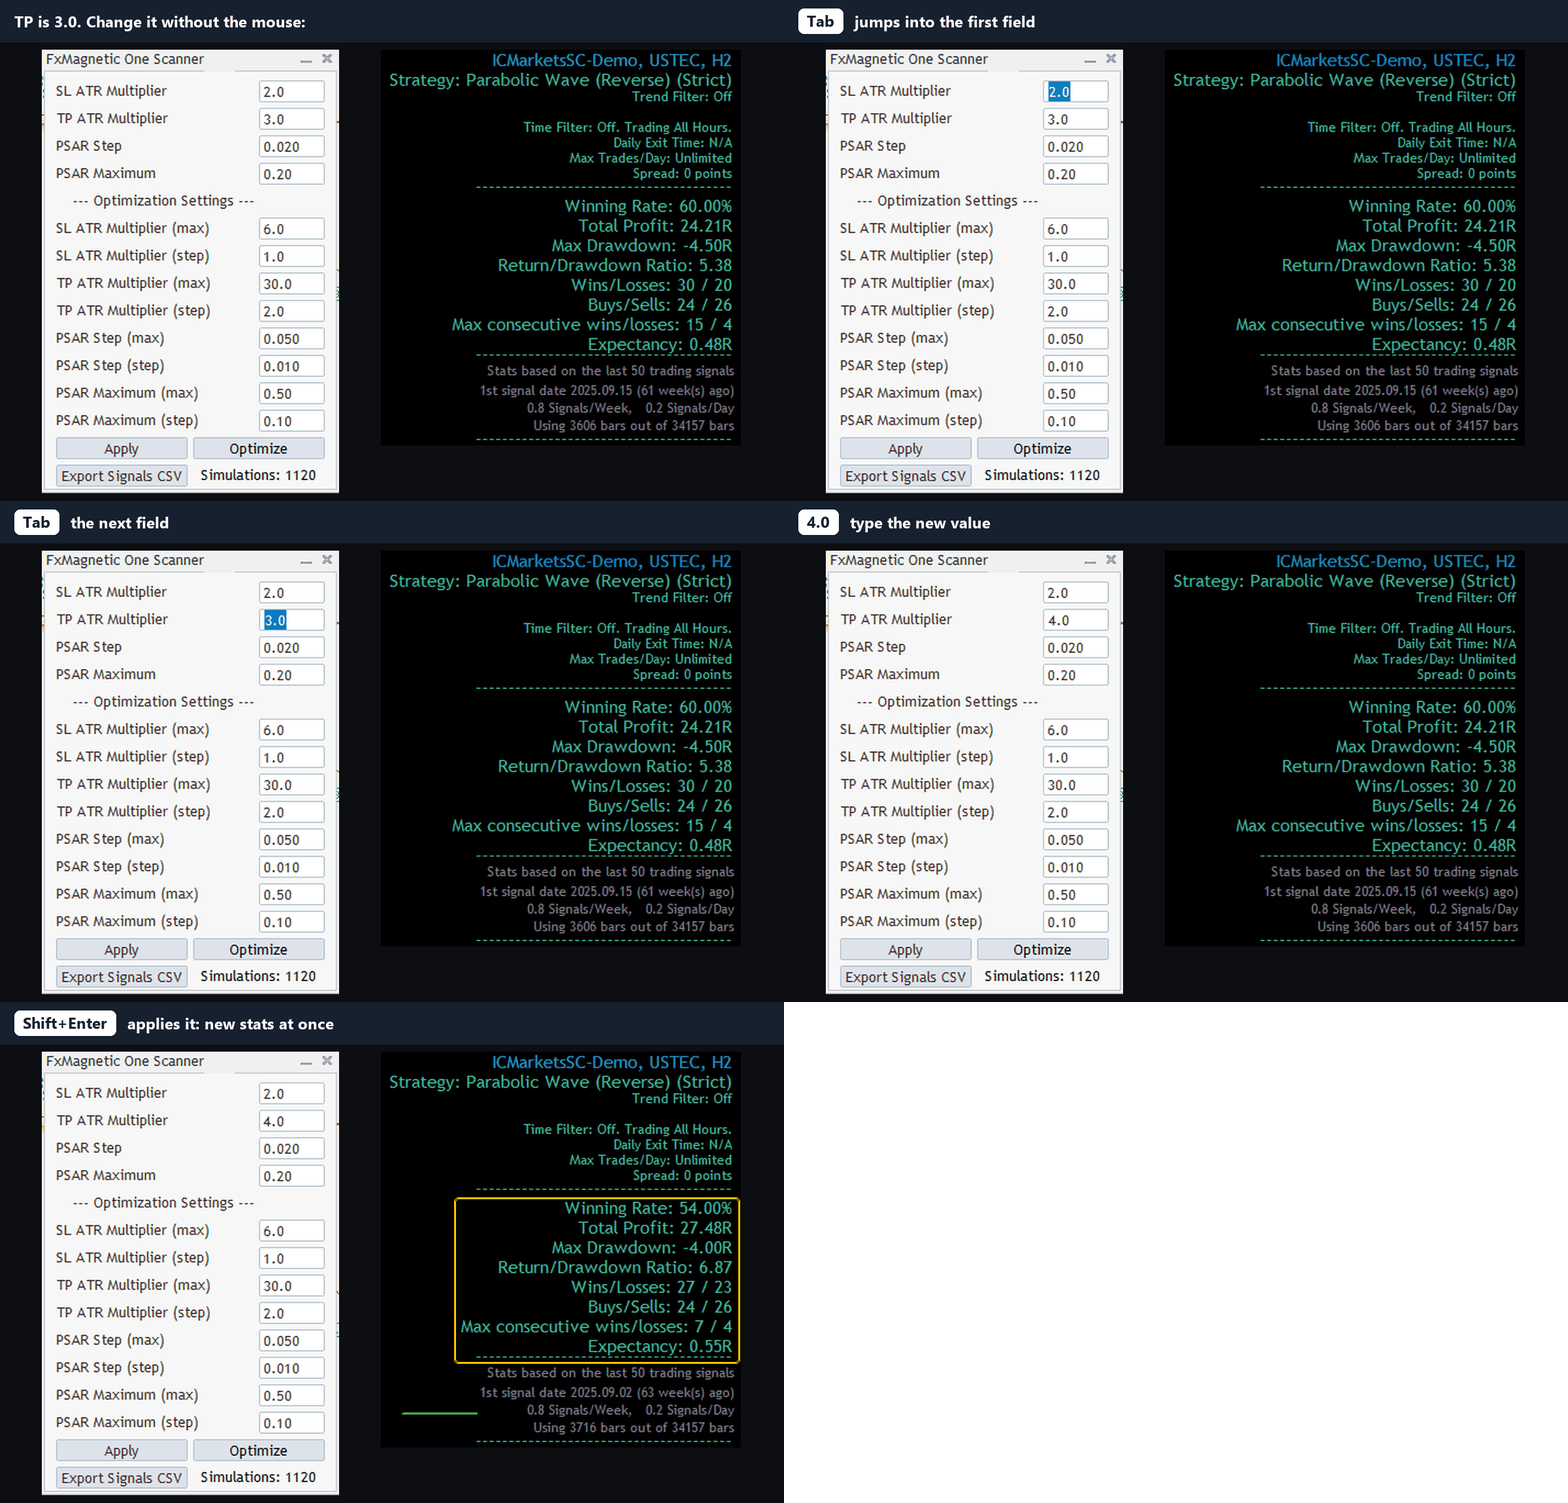
Leave the Optimization Settings (the max and step fields) alone. They are only used by Optimize.
Step 4: Check the result
Compare the statistics on the chart with the green columns of the row: Winning Rate with WinRate, Total Profit with ProfitLossRMultiples, Max Drawdown with MaxDDPercent (both in R at 1% risk) and the number of signals with SignalCount.
- Same numbers: the setup is right.
- Close, but not the same: normal when the chart has newer bars than when the CSV was made, or when your broker’s prices differ (see Broker Data Paradox).
- Very different: check the Strategy line on the chart first (name and “(Strict)” or “(Flexible)”), then the trade filter, the trading hours and the clock. These are the values that are most often missed.
To trade the strategy automatically, attach the Autotrader to the same chart in Indicator Sync mode; it takes all these settings from the Scanner. See How to Use the FxMagnetic Autotrader.
If the CSV opens in one column or the numbers look wrong
The Scanner writes the CSV with commas between columns and a dot as the decimal point. If your Excel uses other regional settings (common in Europe), the file may open in a single column, or 0.015 may turn into 15 or a date. Three easy fixes:
- In Excel, use Data > From Text/CSV, choose Comma as the delimiter and set the locale to English (United States).
- Or open the file in Google Sheets or LibreOffice and choose comma as the separator.
- Or, before the next Optimize run, set the Scanner input CSV Delimiter to ; (semicolon).
When in doubt, open the CSV in Notepad: it shows the exact values the Scanner wrote.
FAQ
Do I have to type the settings by hand?
Yes. The CSV is a list of results; the Scanner doesn’t load a row by itself. With Tab and Shift+Enter it takes less than a minute.
Which row should I choose?
The highest profit is not always the best choice. Many traders look for enough signals, a small maximum drawdown, a good Return/Drawdown ratio and few losses in a row, and check that the neighbouring rows (similar settings) are profitable too. Past results do not guarantee future results.
Can I use a CSV made on MT4 for MT5, or on another broker?
Yes. The settings are the same on MT4 and MT5. The results may differ a little, because every broker’s price data is different.
Can I do this from a screenshot instead of a CSV?
Yes, see How to Set Up a Strategy in the FxMagnetic Scanner From a Screenshot.
