
To set up a strategy from a screenshot of the FxMagnetic Scanner, read two places on it. The statistics on the right show the strategy, Strict or Flexible, trade filters, trading hours, exit time, trades per day, spread and the number of signals; you set these in the Scanner’s Inputs tab. The settings panel on the left shows the stop-loss and take-profit multipliers and the two strategy parameters; you type these into your own panel and press Apply. Open a chart with the same symbol and timeframe first, and your statistics should look very similar.
This tutorial is for FxMagnetic 3.0.2 on MT4 and MT5 and works the same in every app: FxMagnetic One, Technical Labs, Candlestick Labs, Alpha and the single Trader apps. For a Breakout Trader example, see also How To Read & Set Up Strategy Settings From The Screenshot (Breakout Trader).
The two areas to read
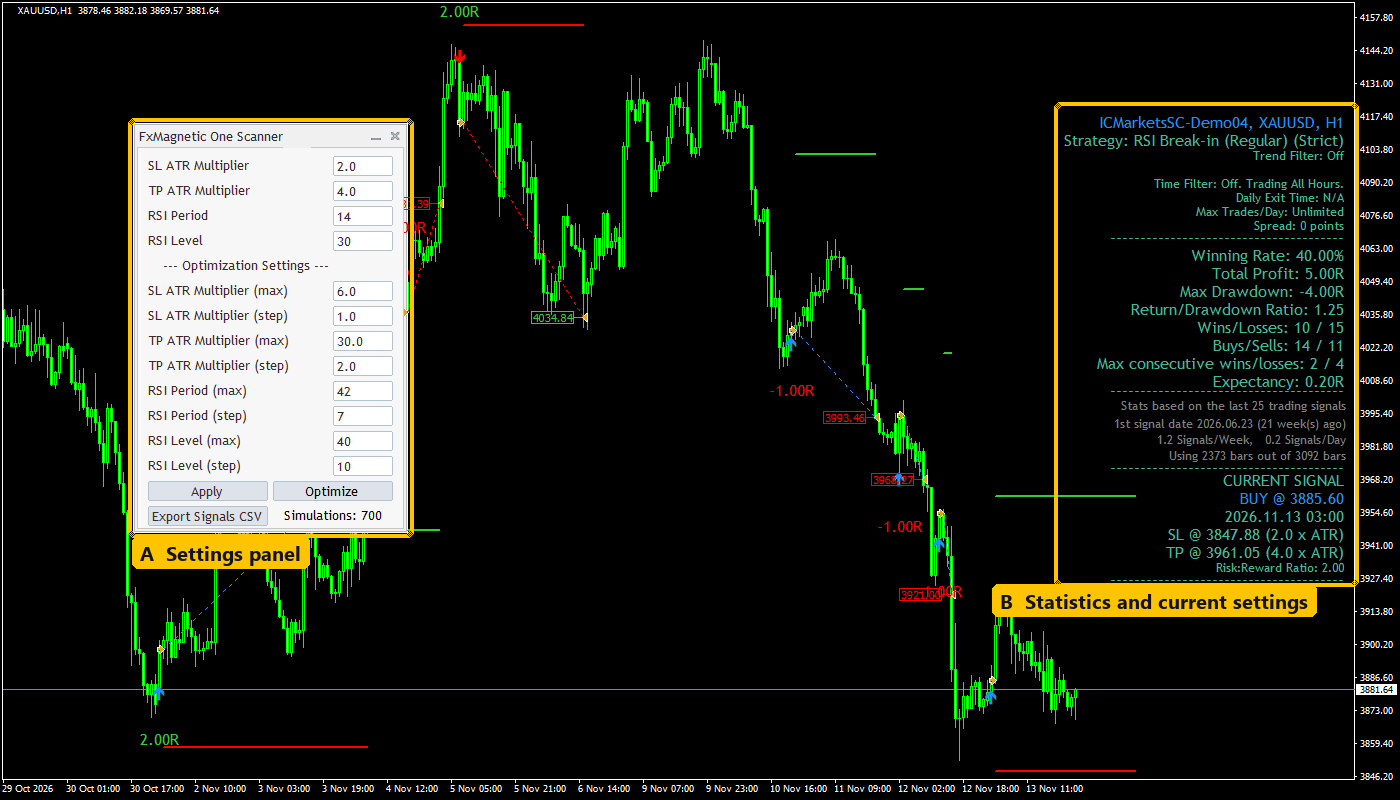
FxMagnetic One 3.0.2 on XAUUSD H1 (MT4, IC Markets demo). A = settings panel, B = statistics and current settings. Click to enlarge.
The symbol and timeframe are in the top-left corner of the chart (here XAUUSD, H1) and again in the blue line above the statistics, after the broker’s server name.
Read the statistics (B)
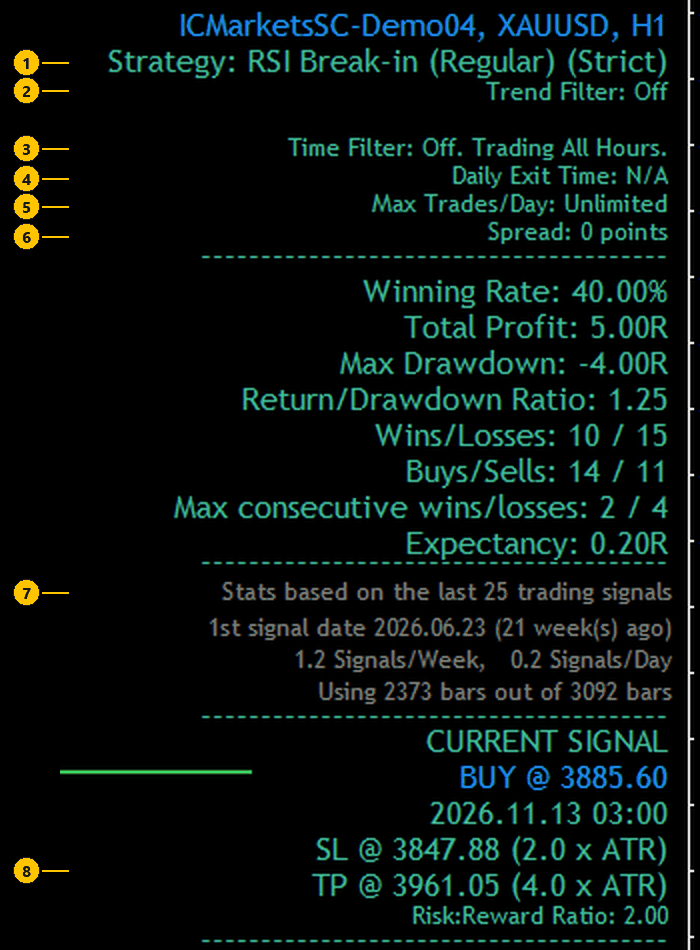
| # | On the screenshot | Example | Set it in the Inputs tab |
|---|---|---|---|
| 1 | Strategy line | RSI Break-in (Regular) (Strict) | (P2) Trading Strategy = the name; (P3) Pattern Flexibility Selector = Strict or Flexible (long names show “(S)” or “(F)”) |
| 2 | Trend Filter line (a second line below it = filter #2) | Off | (P6a) Trade Filter #1, timeframe (P6b) and parameters (P6c), (P6d). Example: “EMA (H4, 200, 0) (Above=Buy/Below=Sell)” = EMA filter, (P6b) H4, (P6c) 200, (P6d) 0. Filter #2 goes to (P7a)–(P7e). |
| 3 | Time Filter | Off. Trading All Hours. | (P8a) Custom Trading Hours (empty when Off) and (P8c) Clock. Example: “Time Filter: 09:30-10:30 New York = server 16:30-17:30” = (P8a) 09:30-10:30, (P8c) New York. No city = Broker server time. |
| 4 | Daily Exit Time | N/A | (P8b) Daily Exit Time (empty when N/A) |
| 5 | Max Trades/Day | Unlimited | (P5) Max Trades Per Day (Unlimited = 0) |
| 6 | Spread | 0 points | (P9) Artificial Spread (points) |
| 7 | Stats based on the last … trading signals | 25 | (P1) How many signals to display |
| 8 | SL and TP of the current signal | (2.0 x ATR), (4.0 x ATR) | (P4a) SL/TP Type: “x ATR” = ATR. The panel’s field names tell you too (“SL ATR Multiplier” = ATR). |
Two small marks are not settings: an arrow or sign in front of the filter line shows the filter’s direction right now (^ = buys only, v = sells only), and an “x” in front of the Time Filter means the trading window is closed at the moment.
Read the settings panel (A)
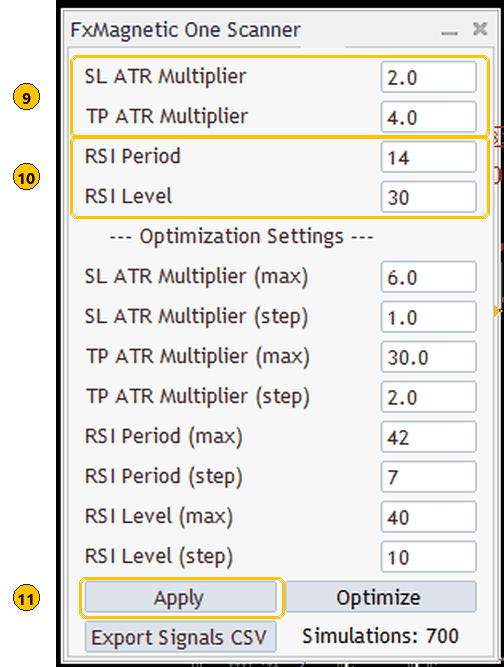
- 9: stop loss and take profit (here SL ATR Multiplier 2.0 and TP ATR Multiplier 4.0).
- 10: the two strategy parameters. Their names depend on the strategy, here RSI Period 14 and RSI Level 30.
- 11: Apply.
Ignore the Optimization Settings below them (max and step). They only matter for Optimize and don’t change the strategy’s signals.
Set it up on your chart
- Open the chart. Same symbol and timeframe as on the screenshot (XAUUSD, H1 in the example). Your broker’s symbol may have a suffix, such as XAUUSD.r.
- Set the Inputs. Press Ctrl+I, select the FxMagnetic Scanner, click Edit and, on the Inputs tab, set lines 1 to 8 from the table. In the example: (P1) 25, (P2) RSI Break-in (Regular), (P3) Strict, (P4a) ATR, (P5) 0, no trade filter, (P8a) and (P8b) empty, (P9) 0. Click OK.
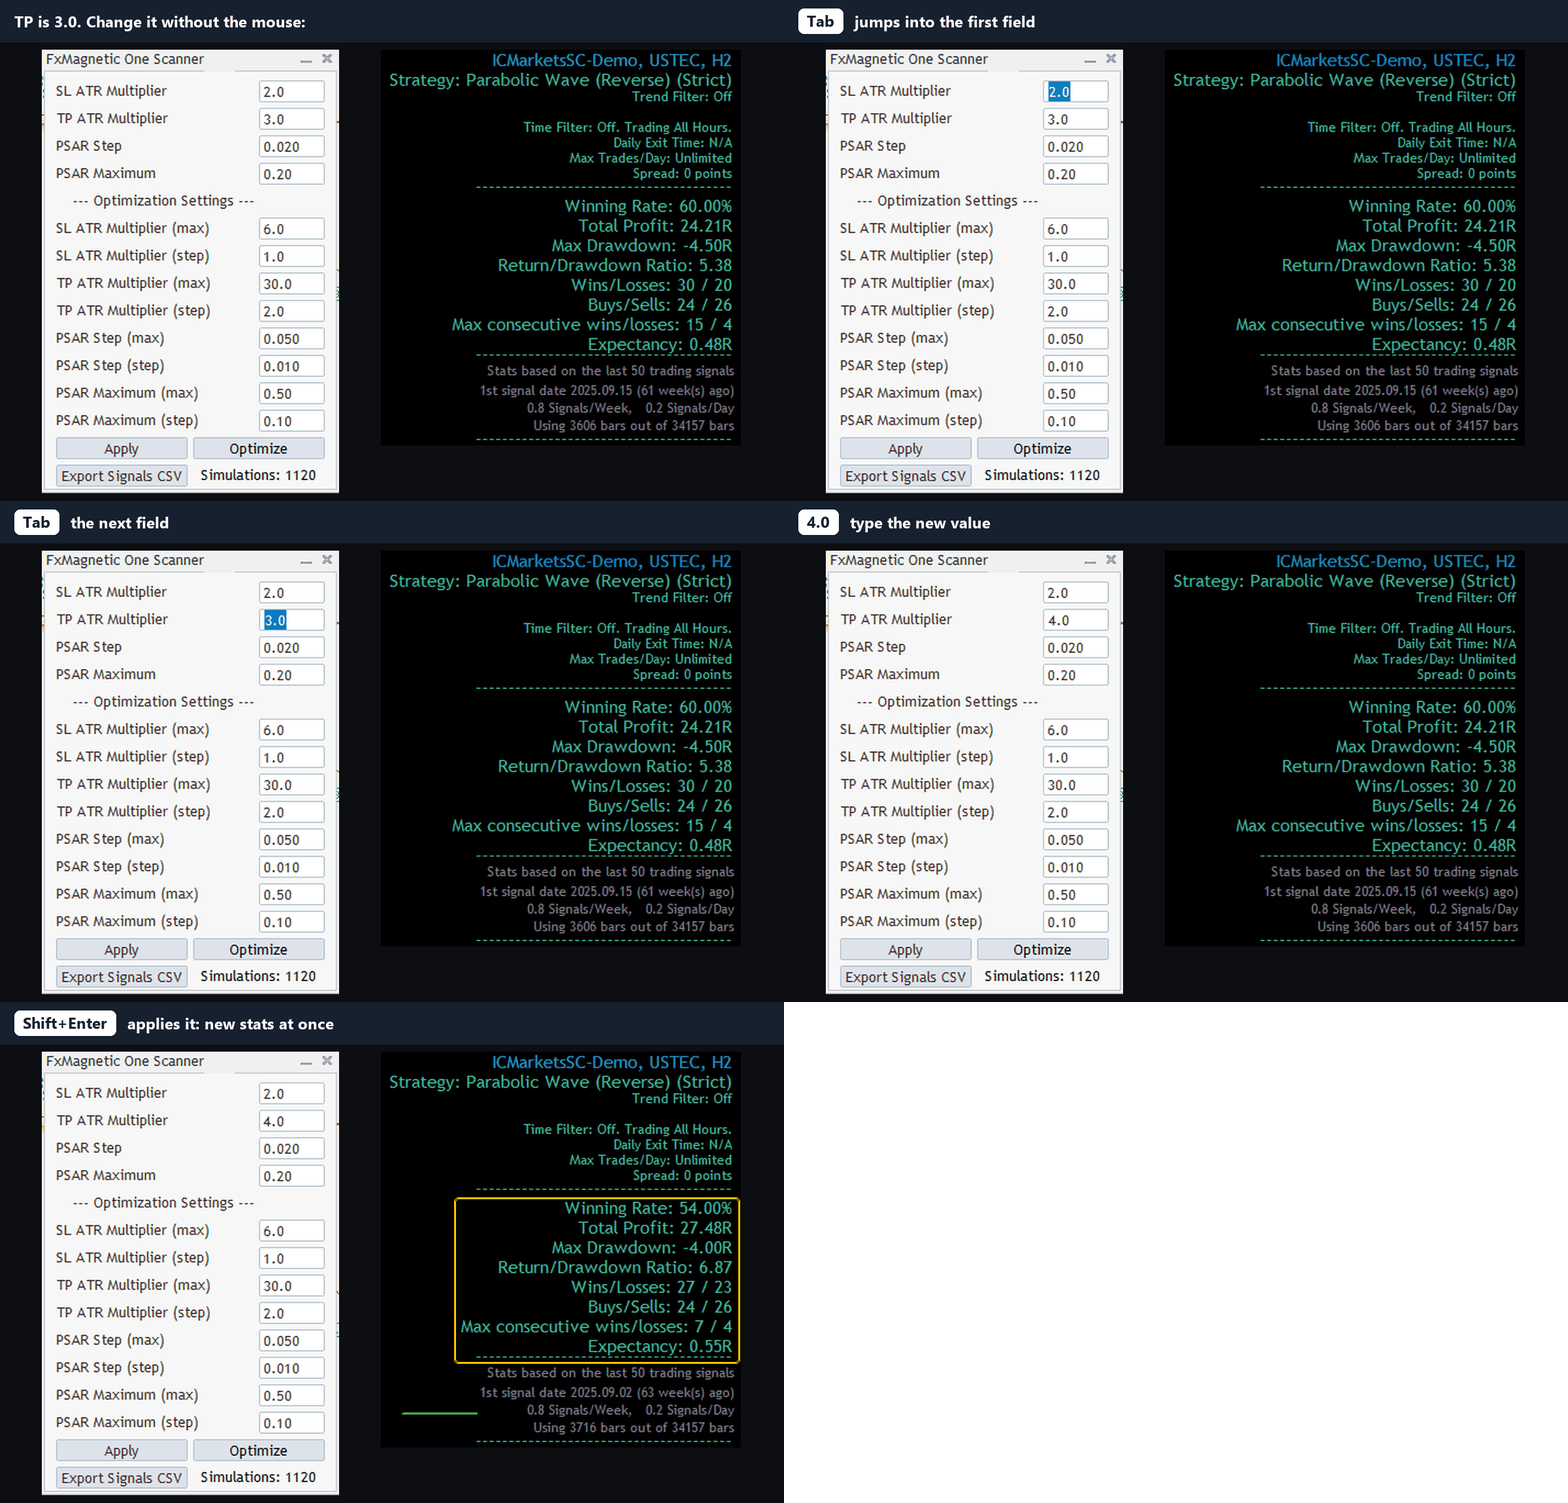
- Type the panel values. Press Tab to get to the first field, type 2.0, Tab, 4.0, Tab, 14, Tab, 30, and press Shift+Enter (or click Apply).
- Compare. Check that the Strategy line on your chart says the same as the screenshot, then compare the statistics: in the example 40.00% winning rate, total profit 5.00R, maximum drawdown -4.00R and 25 signals.
Your numbers can differ a little when your chart has newer bars than the screenshot, or when your broker’s prices are different (see Broker Data Paradox). If they are very different, check the Strict/Flexible mode, the trade filter and the clock of the trading hours first.
What a screenshot can’t show
- (P4b) SL/TP Parameter and the third filter parameters (P6e)/(P7e) are not on the chart. They are almost always -1 (the default); if the statistics don’t match, ask the person who sent the screenshot.
- The Autotrader settings (lot size or risk, magic number, break even, trailing stop) are separate. See How to Use the FxMagnetic Autotrader.
Tips for sharing a screenshot
- Show the whole chart: the settings panel and the statistics, plus the chart’s symbol and timeframe. Don’t crop either one.
- In MetaTrader 4, right-click the chart and choose Save As Picture; in Windows, Win+Shift+S works on MT4 and MT5. More: How to save an MT4 screenshot.
- If you have the CSV file of an Optimize run, sharing a row is even more exact: see How to Set Up a Strategy in the FxMagnetic Scanner From a CSV File.
FAQ
Where do I find the strategy name in the Inputs?
In (P2) Trading Strategy. The list uses the same names as the Strategy line on the chart.
The screenshot shows “(S)” after the strategy. What is it?
Strict. Long strategy names don’t fit with “(Strict)” or “(Flexible)” on MT4, so the Scanner shows “(S)” or “(F)”.
Does this work for a screenshot from MT5 on MT4, or the other way round?
Yes. The settings are the same on both platforms. Only MT5-only timeframes (such as H2 or M10) can’t be opened on MT4.
Can I trade the strategy automatically after this?
Yes. Attach the Autotrader to the same chart in Indicator Sync mode; it takes the strategy, filters and trading hours from the Scanner.
