
In this tutorial, we will walk you through the process of discovering winning trading strategies effectively with FxMagnetic Parabolic Trader. You’ll learn essential setup steps, from platform configuration to historical data preparation, and understand how to implement profitable PSAR trading strategies.
This guide breaks down the process into manageable steps: software setup, strategy building using PSAR parameters, optimization techniques, and auto trader implementation. We’ll also cover crucial aspects of strategy monitoring and portfolio management to help you stay on track.
We created this to help new and experienced FxMagnetic users effectively utilize Parabolic Trader’s features.
Initial Setup Checklist
Before beginning any strategy development, access Welcome & Bonus downloads and Setup Checklist from the Download Center in your course access section. This document guides the entire setup and optimization process.
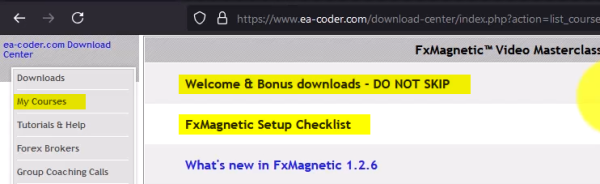
To Access Download Center:
- Log into your account
- Click Access Course
- Locate the Setup Checklist document
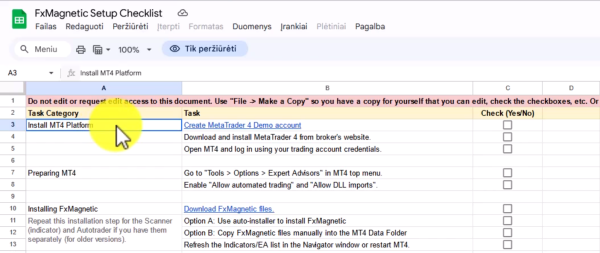
- Upon opening the document, click File > Make A Copy
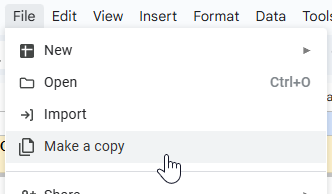
- Save the copy in your own Google Drive
- Use this checklist as your guide as you progress
Following the FxMagnetic Setup Checklist is crucial to successfully using the software.
Downloading And Installing FxMagnetic Software
The installation process for any FxMagnetic Software (i.e, Candlestick, RSI, BB, MACD, etc.) is similar. You can read more about it here.
Preparing Historical Data
Sufficient historical data is essential for accurate backtesting and strategy optimization. Without this, the potential of the software and backtesting results will be limited.
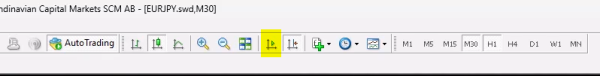
Chart Preparation:
- Open desired trading pair chart
- Select preferred time frame
- Turn off Auto Scroll
- Zoom out the chart for faster data loading
- Press and hold the Home button on your keyboard
- Wait for data to load to the earliest available date while pressing the Home button
- Once the chart stops scrolling for a few seconds, release the Home button
- Re-enable Auto Scroll
Pro Tip: This procedure must be done for each timeframe and currency pair you want to trade with FxMagnetic.
PSAR Scanner Setup
Before starting, ensure the PSAR Scanner is properly installed in your MT4 platform:
Initial Software Configuration:
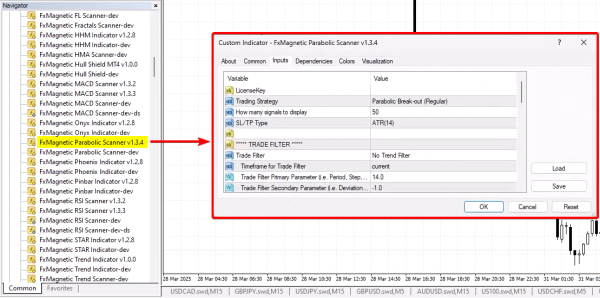
- Find PSAR Scanner in the Navigator window under Indicators in the MT4 platform
- To access it, click on View > Navigator
- Double-click or drag the indicator to chart
- In the Common tab, ensure Allow DLL imports is checked
- Input your license key
Building Your Trading Strategy
This software gives you the freedom to try hundreds of different settings. However, to get started in the right direction, here is an example setting you can try.
Example Settings for NASDAQ 100 (15-minute chart):
- Initially, we suggest you start with the Breakout Regular strategy
- Limit the signal to display to 50
- For stop loss and take profit, choose ATR (14) for dynamic sizing based on volatility
- Set trade filter to No Trader Filter
- Set risk management parameters under OPTIMIZATION SETTINGS:
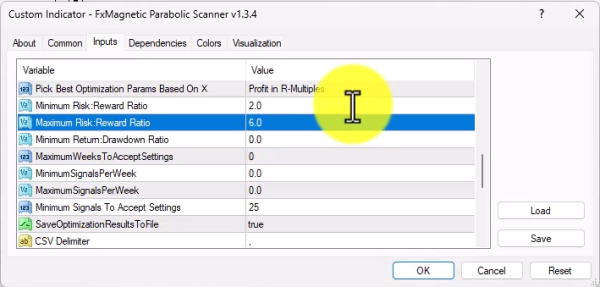
- Minimum Risk-to-Reward Ratio: 2.0
- Maximum Risk-to-Reward Ratio: 6.0
- Minimum Return-to-Drawdown Ratio: 8.0
- Maximum Weeks To Accept Setting: 30
- Minimum Signals Per Week: 0.0
- Maximum Signals Per Week: 8.0
- Minimum Signals To Accept Settings: 50
- Under OTHER SETTINGS, choose R-Multiples for Profit/Loss display mode
- Set Show Strategy Stats to True
- Set Pattern Flexibility Selector to Flexible
- Click OK, you should see something like this.
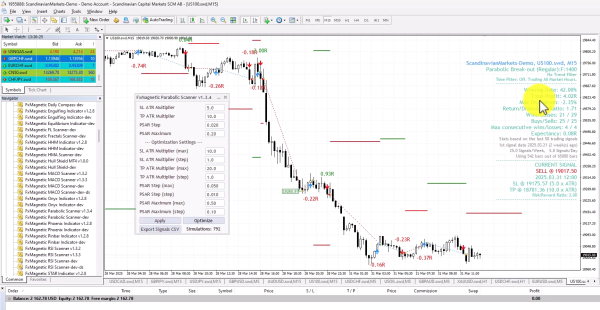
These settings provide a good starting point to get an idea of how the software works. But it is far from profitable and should be optimized for your specific goals and market conditions.
You can also attach the built-in PSAR indicator from Metatrader for better visuals; just make sure to match the parameters.

Strategy Optimization
The optimization process tests thousands of combinations to find the most effective parameters for your strategy.
Preparation:
- Close unnecessary charts to improve processing speed. If possible, close other programs running on your computer, too.
- Click Optimize twice to start the process.
- Typical duration is 10 to 30 minutes depending on the computer’s power (hence closing other charts or programs).
- The software runs approximately 3,000 or more, depending on your settings.
Review Results (Important!):
- For strategies with a risk-to-reward of 2, aim for a win rate of 50% or higher. Note that higher risk-to-reward naturally lowers the win rate %.
- Evaluate total profit (in R-multiples)
- Assess drawdown levels (preferably below 10%)
- Review return-to-drawdown ratio (aim for 8 or higher)
- Examine trade frequency (8-10 signals per week is reasonable for active trading)
- Note maximum consecutive losses (important for risk management assessment)
All optimization results are saved as CSV files that can be accessed through File > Open Data Folder > MQL4 > Files. It is important to consider that the initial results are only benchmarks.
Aside from optimization, you can also fine-tune your result by using other setting parameters such as the filters. Use them right, and it could greatly enhance your results.
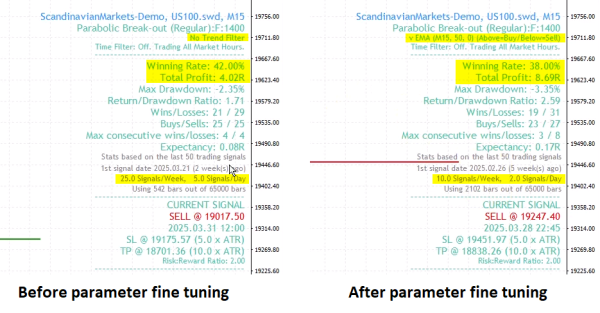
This screenshot demonstrates that adding the EMA filter resulted in a trade-off of getting a higher risk-to-reward ratio trade signals in exchange for a reduced win rate.
These trade-offs are normal. Whether this is good or bad depends entirely on your trading style and personality type.
Auto Trader Configuration
Upon attaching to the chart, the PSAR Autotrader automates the PSAR Scanner indicator. Using it together ensures consistent execution without emotional interference.
Basic Setup:
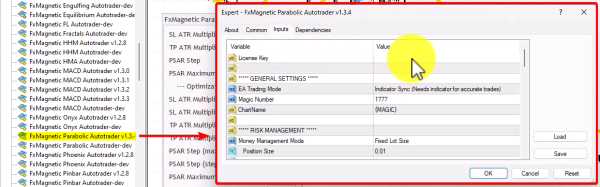
- Locate PSAR Autotrader in the Expert Advisors list under Navigator.
- Drag to the same chart where your PSAR scanner is attached
- In the Common tab, ensure both Allow DLL imports and Allow live trading are checked
- Input your license key
- Select Indicator Sync Mode under EA Trading Mode (recommended default)
- Set a unique Magic Number for strategy identification (example: 1777, 10, 125, etc.)
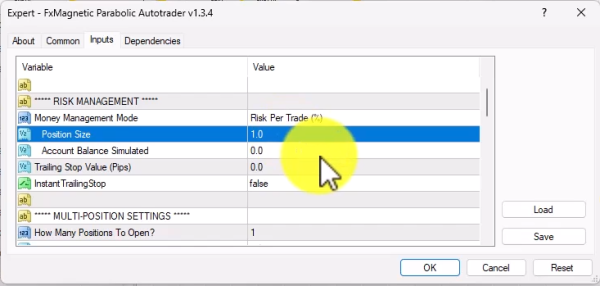
Risk Management Settings:
- For Money Management Mode, choose Risk Per Trade (%)
- Set risk per trade (1% recommended for most strategies)
- Verify lot size and margin requirements displayed
Verifying The Setup:
Once the setup is done, the auto-trader will print information on the top left corner of the chart.
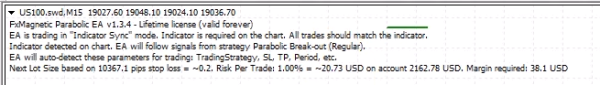
- Strategy being followed
- Current parameters detected
- Lot size calculation
- Risk per trade in monetary value
- Required margin
The auto trader will not open trades for currently active or historical signals. It will only execute new signals as they appear based on the strategy rules.
Strategy Monitoring
Proper monitoring ensures strategy effectiveness and helps identify when adjustments are needed.
Performance Metrics:
- Monitor consecutive wins/losses
- Track win rate percentage
- Review profit/loss ratios
- Evaluate drawdown levels
- Watch trade frequency
Strategy Validation:
- Allow a minimum of 20-30 trades for statistical significance
- Watch for maximum consecutive losses as an indicator for reoptimization
- If losses exceed the historical maximum from the backtest, consider reoptimization
- Track each strategy’s performance separately (use MyTradebook or similar tools)
- Compare results against backtest expectations
Tips For Success
- Higher time frames mean fewer but better quality trades – this is how real money is made in trading. The market wants you to overtrade on low time frames, but that’s often where traders lose. In short, quality vs. quantity.
- Be patient with results. Some strategies might need 5 days (or more) before you see your first winning trade. Understand this so you can avoid overtrading.
- Don’t abandon your strategy when market behavior changes. Use maximum consecutive losses from backtesting as a guideline for when to reevaluate.
- A strategy with a high risk-to-reward ratio usually has longer losing streaks, while a strategy with a low risk-to-reward ratio has fewer losing streaks. You aim to find a system that gives good returns while keeping your drawdowns low.
- Never judge multiple strategies by overall account balance. A profitable strategy might be hidden under a losing one – track them separately.
- A 100% win rate strategy does not exist. Keep this in mind so you can avoid over-optimizing. Aim for a strategy which has great statistics where the win rate is high enough to be profitable.
- Regularly check for software updates to benefit from improvements and new features.
- Consider using a VPS (Virtual Private Server) if you want to run strategies 24/7 without keeping your computer on.