In this tutorial, we will explore the three core trading strategies available in FxMagnetic Stochastic Trader: Stochastic Reversal, Stochastic Power Move, and Stochastic Breakout. Each strategy comes with multiple operational modes which can help you take advantage of different market conditions and achieve better trading results.
This guide will jumpstart your progress with FxMagnetic Stochastic Trader so you can start utilizing its capabilities effectively.
Built-In Trading Strategies Quick Look
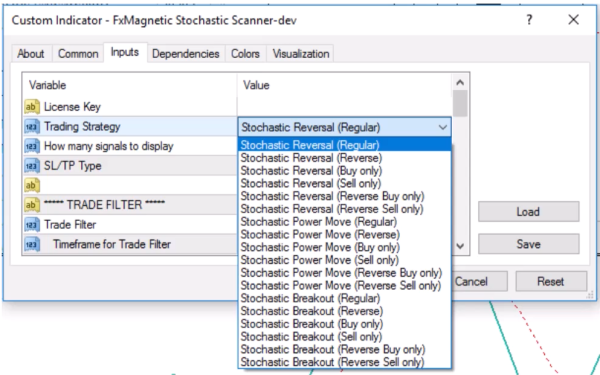
FxMagnetic Stochastic Trader offers these trading styles:
- Stochastic Reversal
- Modes: Regular, Reverse, Buy Only, Sell Only, Reverse Buy Only, Reverse Sell Only
- Stochastic Power Move
- Modes: Regular, Reverse, Buy Only, Sell Only, Reverse Buy Only, Reverse Sell Only
- Stochastic Breakout
- Modes: Regular, Reverse, Buy Only, Sell Only, Reverse Buy Only, Reverse Sell Only
What Is the Stochastic Oscillator?
The Stochastic Oscillator is a momentum indicator that compares a particular closing price of an asset to a range of its prices over a specific period. Important things to understand:
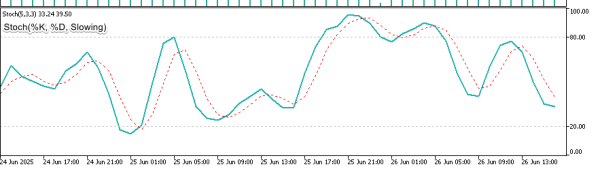
%K Line (Solid/Main Line): The primary stochastic calculation showing where current price sits relative to recent highs and lows. This is the faster, more responsive line that generates initial signals.
%D Line (Dashed/Signal Line): A smoothed moving average of the %K line that acts as confirmation for signals and reduces false entries.
Slowing Parameter: Adds additional smoothing to both lines, making the indicator less sensitive to market noise but more reliable for trend identification.
Key Characteristics
- The indicator consists of two lines: the K line (solid/main line) and the D line (dashed/signal line)
- Values range from 0 to 100
- Standard overbought level is typically above 70-80
- Standard oversold level is typically below 20-30
- These levels can be customized based on your trading strategy
- The indicator helps identify potential reversal points and momentum shifts
Understanding The Scanner
The Scanner serves as the analytical engine, processing market data and generating signals based on your configured parameters.
Key points about the Scanner:
- It can operate independently without attaching the built-in MT4 stochastic indicator on your chart.
- Attaching the built-in indicator confirmation is optional but recommended for understanding signal formation. Just ensure the parameters values are similar. I.e., both should have the same %K, %D, and Slowing values.
- The Scanner reads stochastic values directly from MetaTrader’s memory in the background
Scanner Configuration
The Scanner’s configuration panel presents several critical parameters that define your trading approach:
- Stochastic Parameters: K period, D period, and Slowing values
- Stochastic Level: Sets the threshold for overbought/oversold conditions
- Strategy Selection: Choose between Reversal, Power Move, or Breakout approaches
- Trade Direction: Regular, Reverse, or directional-only modes
- Pattern Flexibility: Strict or Flexible modes
Understanding Stochastic Parameters and Encoding
FxMagnetic Stochastics Trader uses a unique coding system. Instead of entering three separate values, you input a single “stochastic code” that contains all three parameters. Here’s how to decode the stochastic parameters, read from right to left in two-digit parts:
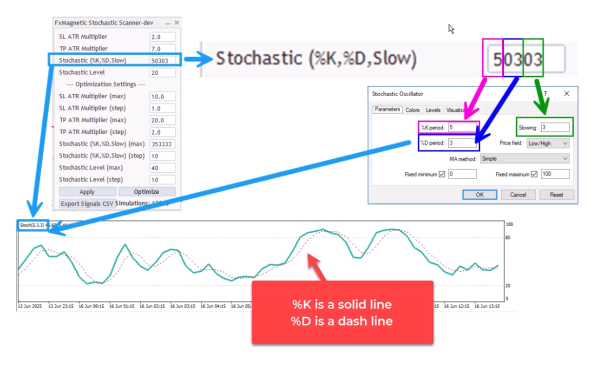
- Last two digits: Slowing parameter
- Middle two digits: %D period
- Remaining digits: %K period
Examples:
- Stochastic Code = 50303
- Slowing = 03
- %D = 03
- %K = 5
- Stochastic Code = 251055
- Slowing = 55
- %D = 10
- %K = 25
- Stochastic Code = 20999
- Slowing = 99
- %D = 09
- %K = 2
Stochastic Level Setting:
When you input one level (e.g., 20), the scanner automatically sets:
- Lower level: 20
- Upper level: 80 (calculated as 100 minus your input)
This creates symmetrical overbought and oversold zones.
Scanner Core Functions
Important technical details:
- The indicator and scanner operate similarly to the actual stochastics indicator.
- It processes price data directly from MetaTrader’s memory
- If you add a visual indicator, ensure all parameters match exactly:
- K, D, and Slowing periods must be identical
- Stochastic levels must align
- Price application must be consistent
Trading Modes
Each strategy can be executed in different operational modes:
Regular Mode
- Takes both buy and sell trades
- Closes existing trades when opposite signal appears
- Only one trade opens at a time
Reverse Mode
- Takes opposite trades from what the strategy indicates
- Example: Takes sell trade when strategy shows buy signal
- Useful when traditional logic performs inversely
Buy Only Mode
- Only takes buy trades
- Holds until stop loss or take profit
- Ignores sell signals
Sell Only Mode
- Only takes sell trades
- Holds until stop loss or take profit
- Ignores buy signals
Reverse Buy Only Mode
- Looks for buy signals but takes sell trades instead
- Combines directional filtering with reverse logic
Reverse Sell Only Mode
- Looks for sell signals but takes buy trades instead
- Opposite of Reverse Buy Only
Strategy Deep Dive
1. Stochastic Reversal Strategy (Regular Mode)
Trades potential reversals when both stochastic lines cross near extreme levels, following traditional mean-reversion logic.
- Buy Entry: Enter a buy trade when the Stochastic %K and %D lines cross upward near a lower level.
- Sell Entry: Enter a sell trade when the Stochastic %K and %D lines cross downward near a higher level.
- Pattern Flexibility Selector controls Stochastic Price Field parameter. Strict=Low/High. Flexible=Close/Close.
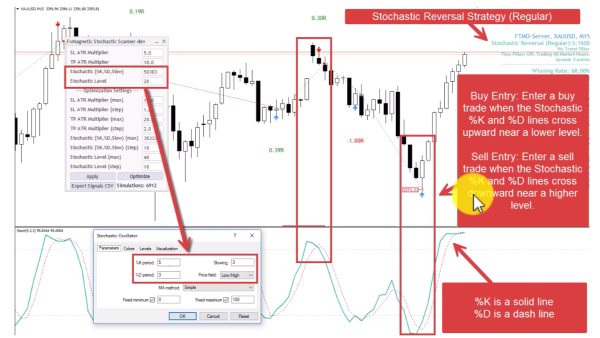
Optimization Notes:
- Uses both K and D lines
- At least one of the lines must touch or come very close to the specified level
- Both lines are relevant for optimization
- Default flexibility uses Low/High price field
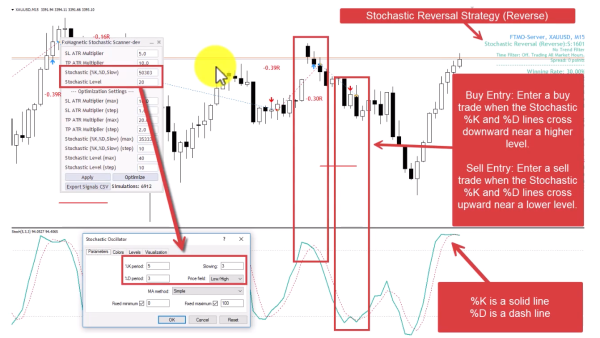
2. Stochastic Reversal Strategy (Reverse Mode)
Same logic as number 1 but trades in the opposite direction – buying at overbought and selling at oversold levels.
- Buy Entry: Enter a buy trade when the Stochastic %K and %D lines cross downward near a higher level.
- Sell Entry: Enter a sell trade when the Stochastic %K and %D lines cross upward near a lower level.
- Pattern Flexibility Selector controls Stochastic Price Field parameter Strict=Low/High. Flexible=Close/Close.
3. Stochastic Power Move Strategy (Regular Mode)
Captures rapid momentum when the stochastic shoots quickly between extreme levels, indicating strong directional movement.
- Buy Entry: Stochastic %K line moves upward between lower-higher levels in 10 bars or less.
- Sell Entry: Stochastic %K line moves downward between higher-lower levels in 10 bars or less.
- Pattern Flexibility Selector controls Stochastic Price Field parameter. Strict=Low/High. Flexible=Close/Close.
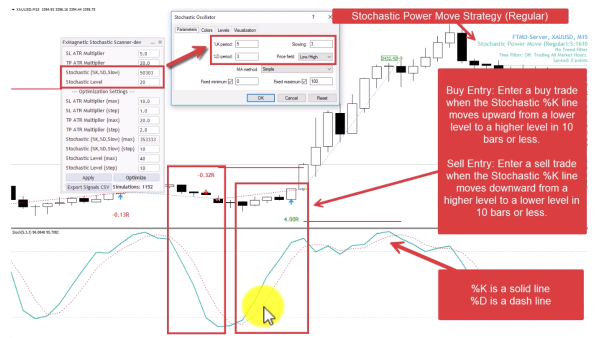
Optimization Note:
- This strategy uses only the K line, so the D period doesn’t affect results.
- Focus optimization on K period and Slowing parameters.
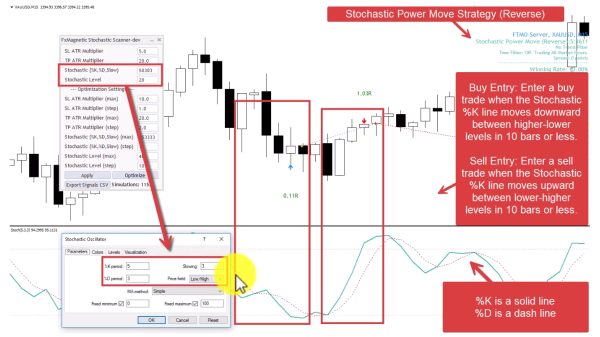
4. Stochastic Power Move Strategy (Reverse Mode)
Contrarian approach to momentum – trades against rapid stochastic movements, betting on quick reversals.
- Buy Entry: Stochastic %K line moves downward between higher-lower levels in 10 bars or less.
- Sell Entry: Stochastic %K line moves upward between lower-higher levels in 10 bars or less.
- Pattern Flexibility Selector controls Stochastic Price Field parameter. Strict=Low/High. Flexible=Close/Close.
5. Stochastic Breakout Strategy (Regular Mode)
Trades when stochastic enters extreme zones, following the momentum into overbought/oversold territory.
- Buy Entry: Enter a buy trade when the Stochastic %K line crosses into the lower level.
- Sell Entry: Enter a sell trade when the Stochastic %K line crosses into the higher level.
- Pattern Flexibility Selector controls Stochastic Price Field parameter Strict=Low/High. Flexible=Close/Close.
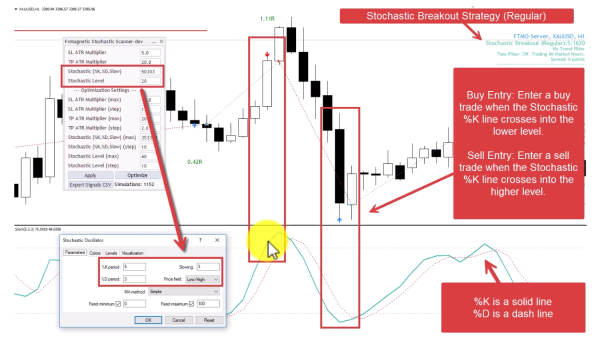
Optimization Note: Uses only %K line, so D period optimization is unnecessary.
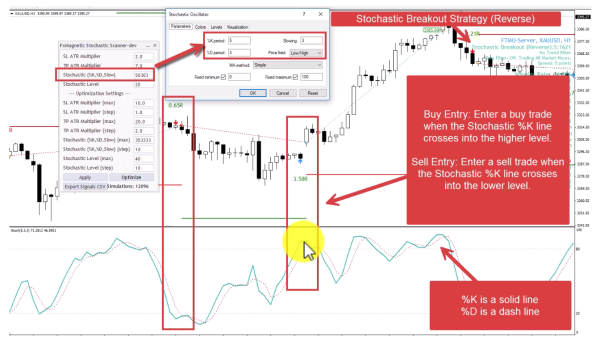
6. Stochastic Breakout Strategy (Reverse Mode)
Contrarian breakout approach – fades moves into extreme zones, betting on immediate reversals from overbought/oversold levels.
- Buy Entry: Enter a buy trade when the Stochastic %K line crosses into the higher level.
- Sell Entry: Enter a sell trade when the Stochastic %K line crosses into the lower level.
- Pattern Flexibility Selector controls Stochastic Price Field parameter Strict=Low/High. Flexible=Close/Close.
Pattern Flexibility Selector Feature
Found in the Scanner inputs, this parameter controls the price field calculation method for the stochastic oscillator, significantly affecting signal generation and indicator behavior:
Strict Mode (S)
- Uses Low/High price field for stochastic calculations
- This is the default setting for the standard stochastic oscillator
- Shows ‘S’ next to the strategy name on your chart
- Generally produces more conservative signal patterns
- Movements tend to be more contained within expected ranges
Flexible Mode (F)
- Uses Close/Close price field for stochastic calculations
- Alternative calculation method that can extend indicator movements
- Shows ‘F’ next to the strategy name on your chart
- May generate more frequent signals due to extended movements
- Can produce deeper penetrations into overbought/oversold zones
Visual Differences:
The choice between Strict and Flexible modes creates noticeably different stochastic indicator behaviors:
- Strict Mode: A movement that barely crosses into the higher level might show minimal penetration
- Flexible Mode: The same market movement could show much deeper penetration into the overbought zone
- Strict Mode: A dip might not even reach the lower level
- Flexible Mode: That same dip could extend well below the oversold threshold
Which is better? Neither mode is universally superior. The effectiveness depends on market conditions, timeframe, currency pair, and the specific strategy being used. This is precisely why we’ve created optimization tools – to test thousands of combinations and determine what works best for your specific trading setup.
Important Trading Rules
- Single Trade Management: The software opens one trade at a time per strategy for better risk management. To run multiple strategies simultaneously, attach the software to different charts.
- Signal-Based Exits: For regular/reverse modes, new opposite signals close existing trades automatically.
- Hold Until Completion: For “only” modes (Buy Only, Sell Only), trades run until stop loss or take profit – no early exits.
- Candle Confirmation: All signals wait for candle close before confirmation – no intra-bar signal changes.
- Algorithmic Consistency: The system takes every signal according to its rules without emotional interference.
- Optimization Requirements: Different strategies require different optimization approaches:
- Reversal: Optimize K, D, Slowing, and Level
- Power Move: Focus on K, Slowing, and Level (ignore D period)
- Breakout: Focus on K, Slowing, and Level (ignore D period)
Monitoring Performance
Track these key metrics for strategy evaluation:
- Win rate percentage (aim for appropriate levels based on risk/reward)
- Maximum consecutive losses (monitor against historical backtesting)
- Return to drawdown ratio (higher is better)
- Total R-multiples gained
- Trade frequency (signals per week)
R-Multiple Explanation: If you risk 1% per trade, that’s your 1R. An 8R profit means 8% return on that trade.
Tips for Success
- Be patient with results. Some strategies might need further optimization before you see your first winning trade.
- For Power Move and Breakout strategies, don’t optimize the D period. Focus on K period, Slowing, and Level parameters only.
- Trade filters will eliminate some bad trades along with good ones. This trade-off is unavoidable but it doesn’t mean you can’t be profitable.
- Test both Strict and Flexible pattern modes during optimization. We never know which works better without testing.
- Add the built-in MetaTrader stochastic indicator for visual confirmation, ensuring all parameters match the scanner exactly.
- A 100% win rate strategy does not exist. Avoid over-optimizing and focus on profitable statistical profiles.