
In this tutorial, we will explore the core trading strategies available in FX Magnetic Parabolic Trader: Parabolic Breakout and Parabolic Wave. Each strategy comes with multiple variations which can help you take advantage of different market conditions and get better trading results in the process.
This guide will jumpstart your progress with FX Magnetic Parabolic Trader so you can start utilizing its capabilities effectively.
Built-In Trading Strategies Quick Look
- Parabolic Breakout
- Modes: Regular, Reverse, Buy Only, Sell Only
- Parabolic Wave
- Modes: Regular, Reverse, Buy Only, Sell Only
What Is the Parabolic SAR?
Parabolic SAR (Stop And Reverse) is a trend-following indicator consisting of dots that appear above or below the price. Important things to understand:
- The dots appear above the price during downtrends and below the price during uptrends
- When the dots flip from above to below the price, it indicates a potential uptrend
- When the dots flip from below to above price, it indicates a potential downtrend
- The indicator uses step and maximum values to control sensitivity
- The dots typically accelerate as trends continue, getting closer to price
- Parabolic SAR is excellent for identifying potential trend reversals
Understanding The Scanner
The Scanner serves as the analytical engine, processing market data and generating signals based on your configured parameters.
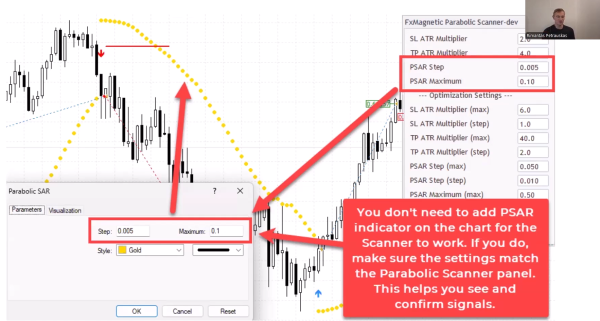
It can operate independently without a visual indicator. Though optional, we suggest you add the built-in Metatrader Parabolic SAR indicator for visual confirmation.
Using both in tandem is a great way to visually verify the Scanner’s decision-making process.
The auto-trader that comes with the software is a great addition for when you find the parameters that work for you and want to automate your trading.
Scanner Configuration
The Scanner’s configuration panel presents several critical parameters that define your trading approach:
- Step: Controls the sensitivity of the indicator (default 0.02)
- Maximum: Sets the maximum acceleration factor (default 0.2)
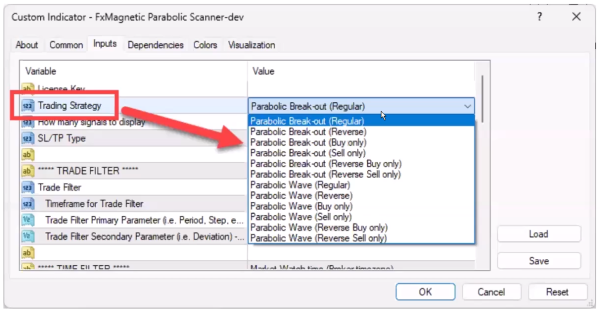
- Strategy Selection: Choose between Breakout or Wave approaches
- Trade Direction: Regular, Reverse, or Directional-only modes
- Pattern Flexibility: Strict or Flexible modes
Each parameter can significantly impact your trading results, making proper configuration essential for optimal performance.
Scanner Core Functions
The Scanner processes price data directly from MetaTrader’s memory, calculating Parabolic SAR values internally. This means you don’t need to display the Parabolic SAR indicator on your chart for the system to function. However, visual confirmation can be valuable for:
- Verifying signal generation
- Understanding dot placement relative to price
- Anticipating potential setups
- Confirming parameter synchronization
When using visual indicators alongside the Scanner, parameter matching becomes critical:
- Step and Maximum values must match exactly
- All calculations must reference the same timeframe
- Both the Scanner and indicator should use the same price data
Trading Modes
Each strategy can be used in different modes:
Regular Mode
- Takes both buy and sell trades.
- Closes existing trades when an opposite signal appears.
- Only one trade opens at a time.
Reverse Mode
- Takes opposite trades from what the strategy indicates.
- Example: Take sell trade when strategy shows buy signal.
Buy Only Mode
- Only takes buy trades.
- Hold until stop loss or take profit.
- Ignores sell signals.
Sell Only Mode
- Only takes sell trades.
- Hold until stop loss or take profit.
- Ignores buy signals.
Reverse Buy-Only Mode
- Only looks for buy signals but takes sell trades instead.
Reverse Sell Only Mode
- Only looks for sell signals but takes buy trades instead.
Pattern Flexibility Selector Feature
This feature controls how the system identifies valid signals. Found in the Scanner inputs, the Pattern Flexibility Selector offers two modes:
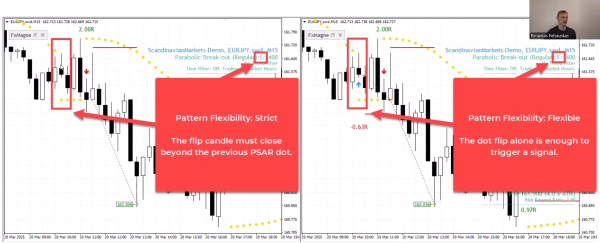
Strict Mode (S)
- The “flip candle” must close beyond the previous PSAR dot
- For buy signals: Candle must close above the previous PSAR dot
- For sell signals: Candle must close below the previous PSAR dot
- Shows as ‘S’ next to strategy name
- Generally produces fewer but potentially more reliable signals
- It may help filter out some false signals
Flexible Mode (F)
- The dot flip alone is enough to trigger a signal
- Does not require the candle to close beyond the previous PSAR dot
- Shows as ‘F’ next to strategy name
- Generates more frequent signals
- Default setting for most strategies
Strategy Deep Dive
Each strategy can be executed in multiple modes to adapt to various market conditions:
1. Parabolic Breakout Strategy (Regular Mode)
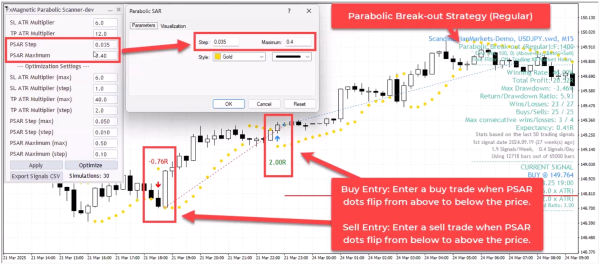
This is the classic implementation of Parabolic SAR trading:
- BUY signal is triggered when PSAR dots flip from above to below the price. The signal candle must close to confirm the entry.
- SELL signal is triggered when PSAR dots flip from below to above price. The signal candle must close to confirm the entry.
Trading begins on the next candle after signal confirmation.
2. Parabolic Breakout Strategy (Reverse Mode)
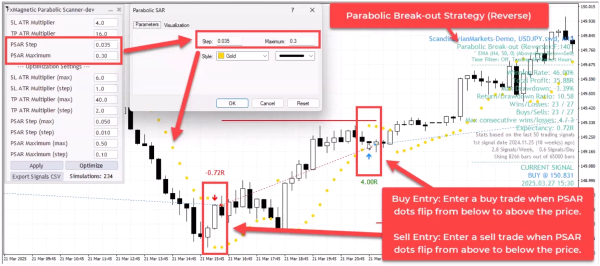
This contrarian approach inverts the traditional signals:
- BUY signal is triggered when PSAR dots flip from below to above price (normally a sell signal).
- SELL signal is triggered when PSAR dots flip from above to below the price (normally a buy signal).
This strategy can be effective in ranging markets or when the traditional breakout signals are consistently failing.
3. Parabolic Wave Strategy (Regular Mode)
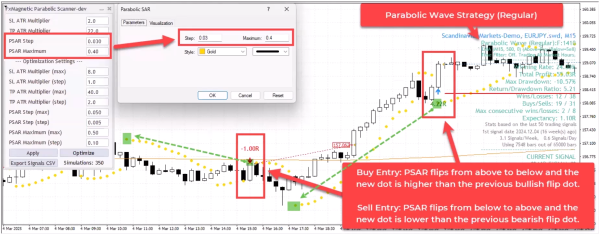
This unique strategy looks for continued momentum in the established direction:
- BUY signal is triggered when PSAR dots flip from above to below price (bullish flip), AND the new PSAR dot is higher than the previous bullish flip dot.
- SELL signal is triggered when PSAR dots flip from below to above price (bearish flip), AND the new PSAR dot is lower than the previous bearish flip dot.
This strategy aims to capture wave continuations and trend strength, potentially filtering out false reversals.
4. Parabolic Wave Strategy (Reverse Mode)
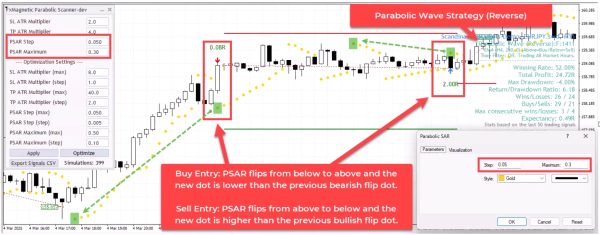
This contrarian approach to the Wave strategy:
- BUY signal is triggered when PSAR dots flip from below to above price (bearish flip), AND the new PSAR dot is lower than the previous bearish flip dot.
- SELL signal is triggered when PSAR dots flip from above to below price (bullish flip), AND the new PSAR dot is higher than the previous bullish flip dot.
This strategy attempts to catch potential reversals when a trend might be overextended.
Important Trading Rules
- The software opens one trade at a time per strategy for better risk management. If you need more than one trade for some reason, or run different strategies at the same time, you can attach the software on another chart.
- For regular/reverse modes, new opposite signals close existing trades.
- For “only” modes, trades run until stop loss or take profit.
- You can use trend filters for additional confirmation (like EMA trend on higher timeframes).
- Consider re-optimizing the parameters or exploring other modes if experiencing more consecutive losses than historically normal.
Monitoring Performance
Track these key metrics:
- Win rate percentage
- Maximum consecutive losses
- Return to drawdown ratio
- Total pips/points gained
- Drawdown percentage
Understanding your numbers is crucial to your trading success. Remember, FxMagnetic can only help speed up your strategy development. Your outcomes would still depend on how well you use the software.
Tips for Success
- When starting out, we recommend you use the built-in Parabolic SAR indicator from MT4 as visual confirmation for the scanner. Just remember to match Step and Maximum settings on both.
- The Wave strategy can be particularly effective during strong trends as it helps you re-enter on wave continuations.
- There is no “best” pattern flexibility setting (Strict or Flexible) – test both on your preferred pairs to determine which works better for your trading approach.
- Sometimes higher timeframes (4H, Daily) produce more reliable Parabolic SAR signals than lower timeframes since lower timeframes produces more noise.
- Consider using trend filters like EMA to confirm the overall market direction before taking signals.
- Each currency pair may respond differently to Parabolic strategies – what works for one pair may not work for another.
- Run optimization on multiple parameter combinations to find the settings that produce the best risk-to-reward ratio.
- Remember that no trading strategy will have a 100% win rate – focus on overall profitability rather than individual trades.