In this tutorial, we will walk you through the process of discovering winning stochastic trading strategies using FX Magnetic Stochastic Trader effectively.
You’ll learn essential setup steps, from platform configuration to strategy optimization, and understand how to implement profitable stochastic-based trading strategies using multiple trading modes and configurations.
This guide breaks down the process into manageable steps: software setup, strategy building using stochastic parameters, optimization techniques, and auto trader implementation. We’ll also cover crucial aspects of strategy monitoring and portfolio management to help you stay on track.
We created this to help both new and experienced FxMagnetic users effectively utilize Stochastic Trader’s features and develop profitable trading strategies.
Initial Setup Checklist
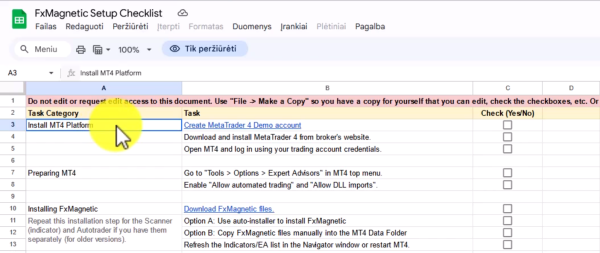
Before beginning any strategy development, access the setup checklist from the download center in your course access section. This document guides the entire setup and optimization process.
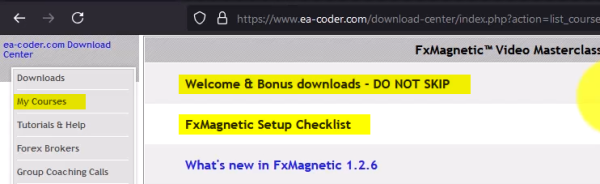
To Access Download Center:
- Log into your account
- Click Access Course
- Locate Setup Checklist document
- Upon opening the document, click File > Make A Copy
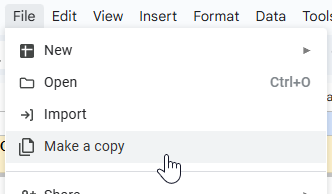
- Save the copy in your own Google Drive
- Use this checklist as your guide as you progress
Important Note: Don’t skip the welcome and bonus downloads section. All promised bonuses and additional resources are available there.
Downloading And Installing FxMagnetic Software
The installation process for any FxMagnetic Software (i.e: Candlestick, RSI, BB, MACD, Stochastics, etc.) is similar. You can read more about it here.
Preparing Historical Data
Sufficient historical data is essential for accurate backtesting and strategy optimization. Without this, the potential of the software and backtesting results will be limited.
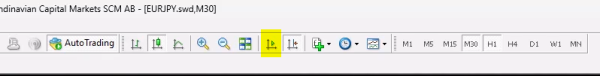
Chart Preparation Steps:
- Open desired trading pair chart
- Select preferred time frame
- Turn off auto scroll
- Press and hold Home button on your keyboard
- Wait for data to load to the earliest available date while holding the Home button
- Once data loading stops (usually after 5 seconds of no movement), release the Home button
- Re-enable auto scroll
Data Requirements:
- Most strategies in general typically need 10,000+ bars while others require 20,000-50,000 bars depending on signal frequency
- Always load as much historical data your broker can provide before running a scan.
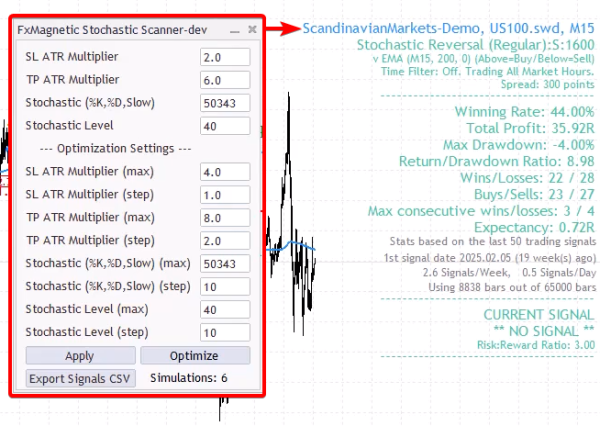
Stochastic Scanner Setup
Before starting, ensure the Stochastic Scanner is properly installed in your MT4 platform. Here are example setting you can try
Initial Software Configuration:
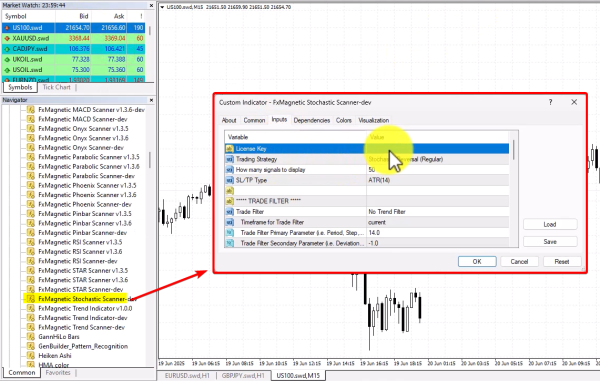
- Find Stochastic Scanner in the Navigator window under Indicators
- Access Navigator by clicking View > Navigator
- Double-click or drag the indicator to chart
- Input license key (found in your download center)
- Initially, start with the Regular strategy
Understanding Stochastic Strategies
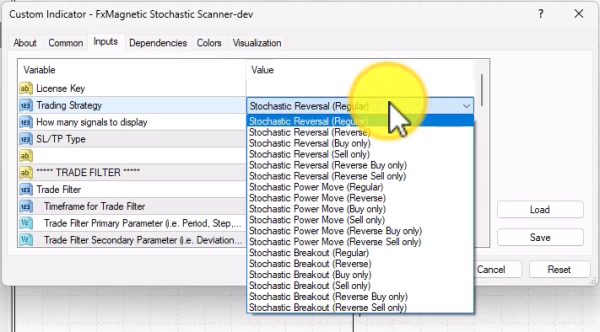
The Stochastic Trader offers three core strategies:
- Stochastic Reversal – Trades reversals at overbought/oversold levels
- Stochastic Power Mode – Trades momentum continuation
- Stochastic Breakout – Trades breakouts from consolidation
Each strategy can be used in different modes:
- Regular Mode: Takes both buy and sell trades
- Reverse Mode: Takes opposite trades from signals
- Buy Only/Sell Only: Directional trading only
Building Your Trading Strategies
This software gives you the freedom to try hundreds of different settings. However, to get you started in the right direction, here are example settings you can try.
- We suggest you start with Reversal (Regular) first.
- For SL/TP Type, choose ATR 14 which is the dynamic version.
- Click OK once these are selected.
- This will take you to your chart where a small panel will appear.
Strategies in general typically need 10,000+ bars while others require 20,000-50,000 bars depending on signal frequency
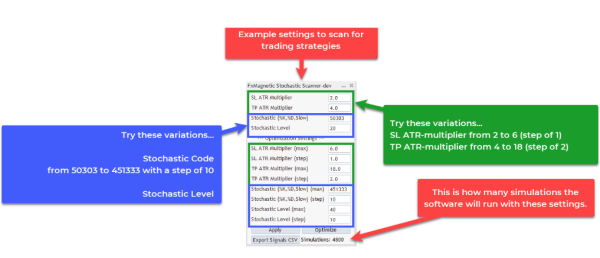
Set the following Parameter Ranges. Here’s an example settings using ATR to set your stop loss and take profit levels:
- SL ATR multiplier from 1 to 6 with the step of 1.
- TP ATR multiplier from 4 to 18 with the step of 2.
- Stochastic (%K, %D, Slow) from 50303 to 451333
- Stochastic Level to 20
Explanation:
- In this configuration, we use the ATR (14) or Average True Range to measure the average candle movement 14 periods back.
- The ATR value will then be used as a basis for risk-to-reward ratio.
- Stochastic (50303 to 451333) combines the %K, %D, and Slowing values.
- %K period: 5 to 45 with step of 10 (testing 5, 15, 25, 35, 45)
- %D period: 3 to 13 with step of 10 (testing 3, 13)
- Slowing: 3 to 33 with step of 10 (testing 3, 13, 23, 33)
- The code format combines these three values – for example, 50303 means K=5, D=3, Slowing=3, while 451333 means K=45, D=13, Slowing=33.
- Stochastic Level (20 to 40): This sets the oversold/overbought threshold zones that define when trading signals are triggered. The optimization will test levels of 20, 30, and 40. These levels work in pairs (with corresponding upper levels of 60, 70, 80) to identify when the market is oversold or overbought, controlling when the stochastic crossover signals are generated.
You can see more sample settings in this cheat sheet.
It’s important to understand that this is just the initial step and you are most likely to find better settings that are more profitable after you optimize.
Keep in mind: Higher timeframes = Less signals but reliable. Lower timeframe = More signals but less reliable. The key is finding a timeframe that fits your trading style and gives you winning results.
Optimizing Your Strategy
The software will test different values within the parameter range to find one with the best result. Approximately, it will run 3,000 simulations depending on your settings, and takes around 10 to 30 minutes depending on your computer.
Preparation:
- We recommend you close unnecessary MT4 charts to improve processing speed. Closing other programs running on your computer can help the optimization to finish faster.
- Set your initial parameters ranges. Do keep a record of the parameter you are currently testing.
- Once you are ready, click Optimize and Start Now?
- Typical duration is 10 to 30 minutes depending on computer power
- The software runs approximately 3,000-6,000 simulations depending on settings
Reviewing The Results (Important!)
The values seen on your chart after the optimization provides an overview of how the strategy’s parameters performed. This alone could help you decide how you will move forward.
You can go in depth by viewing the complete results of the strategy. To view this:
- Go to File then Open Data Folder.
- Inside the Data Folder, go to MQL then File folder.
- Look for the folder of the FxMagnetic scanner you are using on open.
- Open the latest spreadsheet file to see the strategy’s data. This file can be viewed in both Excel and Google Sheets.
- Apply filters to your sheets to help you review the numbers.
When starting, aim for 50% win rate or higher, with a minimum risk to reward ratio of 2. You can adjust this as you go. The strategy’s profitability should be at an acceptable level for you, with a drawdown of less than 10%.
The spreadsheet contains a lot of important information which provides insight so you could make better decisions. Reviewing it regularly is the key to your success.
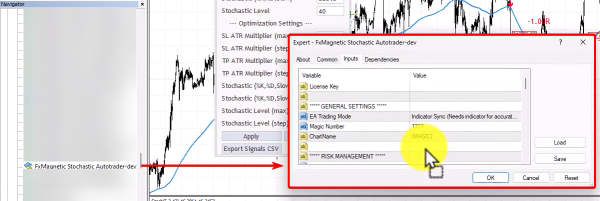
Auto Trader Configuration
Upon attaching to the chart, the Autotrader automates the Stochastic Scanner. Using them together ensures consistent execution without emotional interference.
Basic Setup:
- Locate Stochastic Autotrader listed under Expert Advisors inside the Navigator panel.
- Drag to the same chart where your scanner is attached
- Under Common tab:
- Enable Allow DLL imports
- Enable Allow live trading
- Under Inputs tab:
- Input license key
- Select Indicator Sync Mode (recommended default)
- Set a unique Magic Number for strategy identification (example: 1777, 1, 2, 3, etc.)
- Under Risk Management Settings:
- Set Money Management Mode to Risk Per Trade (%). Choose between:
- Conservative: 0.25-0.5% (recommended for high consecutive loss strategies)
- Moderate: 1% (standard recommendation)
- Aggressive: 1.5%+ (only for low consecutive loss strategies)
The software automatically calculates lot size based on stop loss and account size
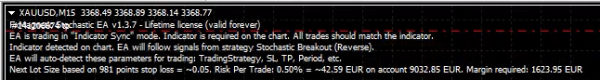
Verifying The Setup:
After confirming the setup (click OK), the auto-trader will print information on the top left corner of the chart. Note that the autotrader won’t work during the weekend. However, this will auto activate as soon as the market opens.
Strategy Monitoring
Proper monitoring ensures strategy effectiveness and helps identify when adjustments are needed.
Performance Metrics:
- Monitor consecutive wins/losses
- Track win rate percentage
- Review profit/loss ratios
- Evaluate drawdown levels
- Watch trade frequency
Strategy Validation:
- Allow minimum 20-30 trades for statistical significance.
- Monitor for three consecutive losses (Potential warning sign if strategy backtest showed 3 consecutive losses in the past).
- Track each strategy’s performance separately.
- Compare results against backtest expectations.
Strategy Portfolio Management
Building a robust trading portfolio requires careful strategy selection and monitoring.
Portfolio Development:
- Begin with 2-3 strategies.
- Add new strategies gradually.
- Diversify across different:
- Currency pairs
- Time frames
- Trading instruments (forex, gold, indices)
Strategy Evaluation:
- Remove underperforming strategies.
- Keep successful strategies.
- Document performance metrics.
- Regular strategy review and optimization.
New Feature: Artificial Spread Implementation
FxMagnetic includes artificial spread functionality to make backtests more realistic:
- Purpose: Simulates real-world entry conditions by accounting for bid-ask spreads
- Typical Settings: 200-300 points for most instruments
- Impact: Creates more accurate backtest results that better reflect actual trading conditions
- Adjustment: May slightly reduce profits and increase drawdowns in backtests compared to zero-spread scenarios
This feature ensures your backtest results more closely match what you’ll experience in live trading, where you’ll always encounter spreads when entering positions.
Tips For Success
- Higher time frames mean fewer but better trades – this is how real money is made in trading. The market wants you to overtrade on low time frames, but that’s often where traders lose. In short, quality vs. quantity.
- Be patient with results. Some strategies might need 5 days (or more) before you see your first winning trade. Understand this so you can avoid overtrading.
- Don’t immediately abandon your strategy when market behavior changes.
- A strategy with a high risk to reward ratio usually has long losing streaks, while a strategy with a low risk to reward ratio has less losing streaks. Your aim is to find a system that gives good return while keeping your drawdowns low.
- Never judge multiple strategies by overall account balance. A profitable strategy might be hidden by a losing one – track them separately.
- Think of strategies like a portfolio. When one isn’t performing well, others might cover for it. Start small, master a few strategies first, then gradually expand.
- A 100% win rate strategy does not exist. Keep this in mind so you can avoid over-optimizing. Aim for a strategy that has great stats where the win rate is high enough to be profitable.
- Always use the same broker for live trading that you used during backtesting. One of FxMagnetic’s key advantages is that you backtest on the exact broker data where you’ll actually trade. Using a different broker for live trading than backtesting makes your backtest results meaningless due to different price data, spreads, and execution conditions.